A CRM for the Equity Buy and Sell Side
UX/UI Designer
2013
Product Team
About
Sunrise Brokers wanted to develop an Equity CRM platform that was able to push clients into investing more, projecting the firm in the new era of Financial Services Technologies.
This complex project included UX research activities, the architecture of primary areas of functionality, strategy and decision on red routes, interaction design and usability testing. I continued to work with Sunrise Brokers to produce a more informative, usable and engaging web-based software solution for financial institutions on the client and buyer side.
Duration
18 Months
How the Equity desk works
An equity desk is where traders and analysts work together to buy and sell stocks for their clients. They use up-to-date market research and technology to make smart choices and handle trades well. The main goal is to increase profits and lower risks for their clients, which can range from individual investors to big institutions. The team keeps an eye on market trends and economic news to adjust their strategies quickly and effectively as the market changes.
Rapid changes in the market can make it difficult to predict stock movements and manage risks effectively, plus higher competition sometimes pushes towards higher risk strategies.
Daily challenges
Before any sketch or personal research, I sat down with the product manager, the Head of the equity, two analyst and a trader to talk about their job, the challenges, the pros and the cons, which shed the light on what users needs to face everyday.
What's happening
Keeping up with global financial news, market trends, and economic indicators that influence stock prices is a constant challenge. This involves analyzing vast amounts of data to make informed trading decisions.
Quick moves
Making sure trades are done fast to avoid missing out on the best prices.
Risk Management
Daily trading involves managing a portfolio’s exposure to risks. This means balancing potential gains with the possibility of losses, and adjusting positions as market conditions change.
Talk to clients
Regularly updating clients on their portfolio performance and market opportunities, and adjusting trading strategies based on their changing needs and risk tolerance.
Follow rules
Ensure all trading activities comply with legal standards, talk to compliance in rare cases.
Tech Truble
Collaborate with internal IT department to fix issues
What have they traded?
Maintaining a history of clients' transactions to tailor future recommendations.
What have we pitched?
Remembering past pitches to avoid redundancy and to refine future proposals.
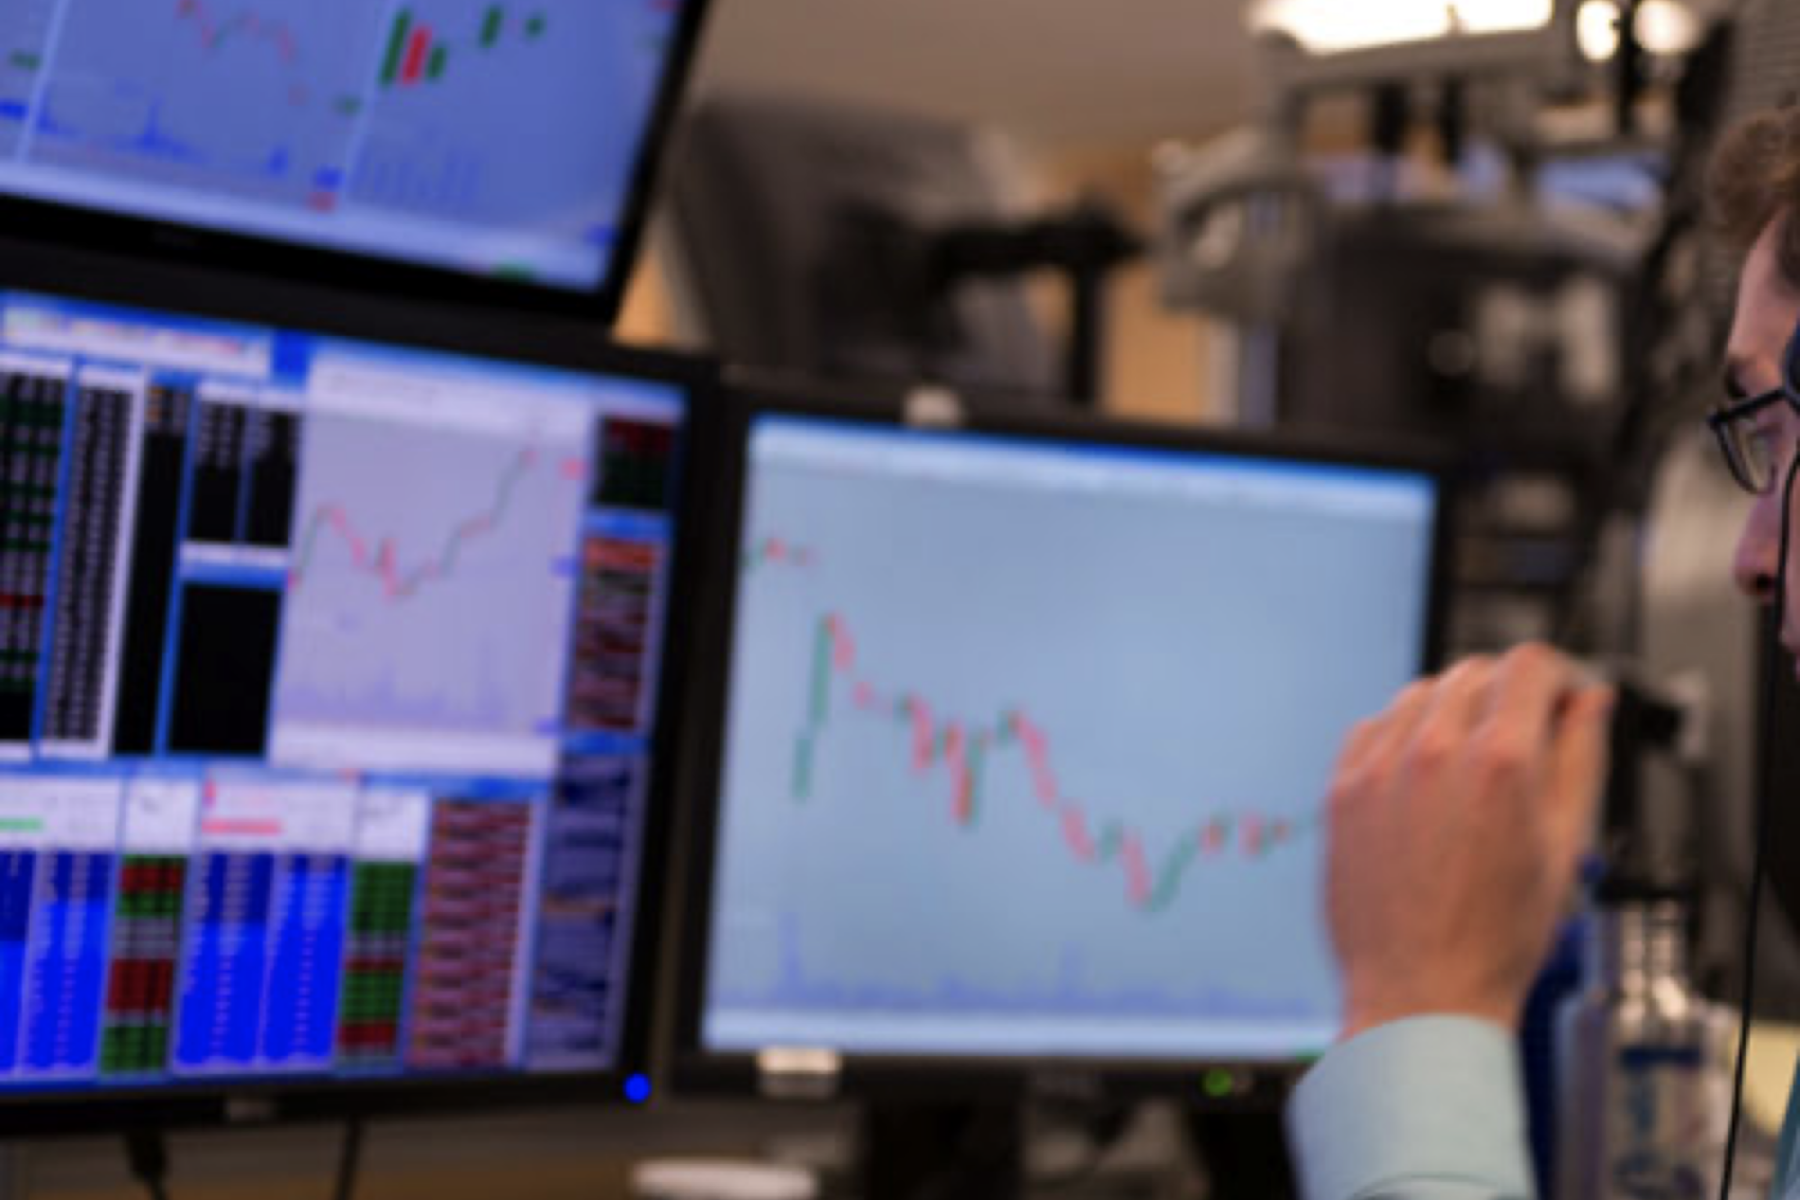
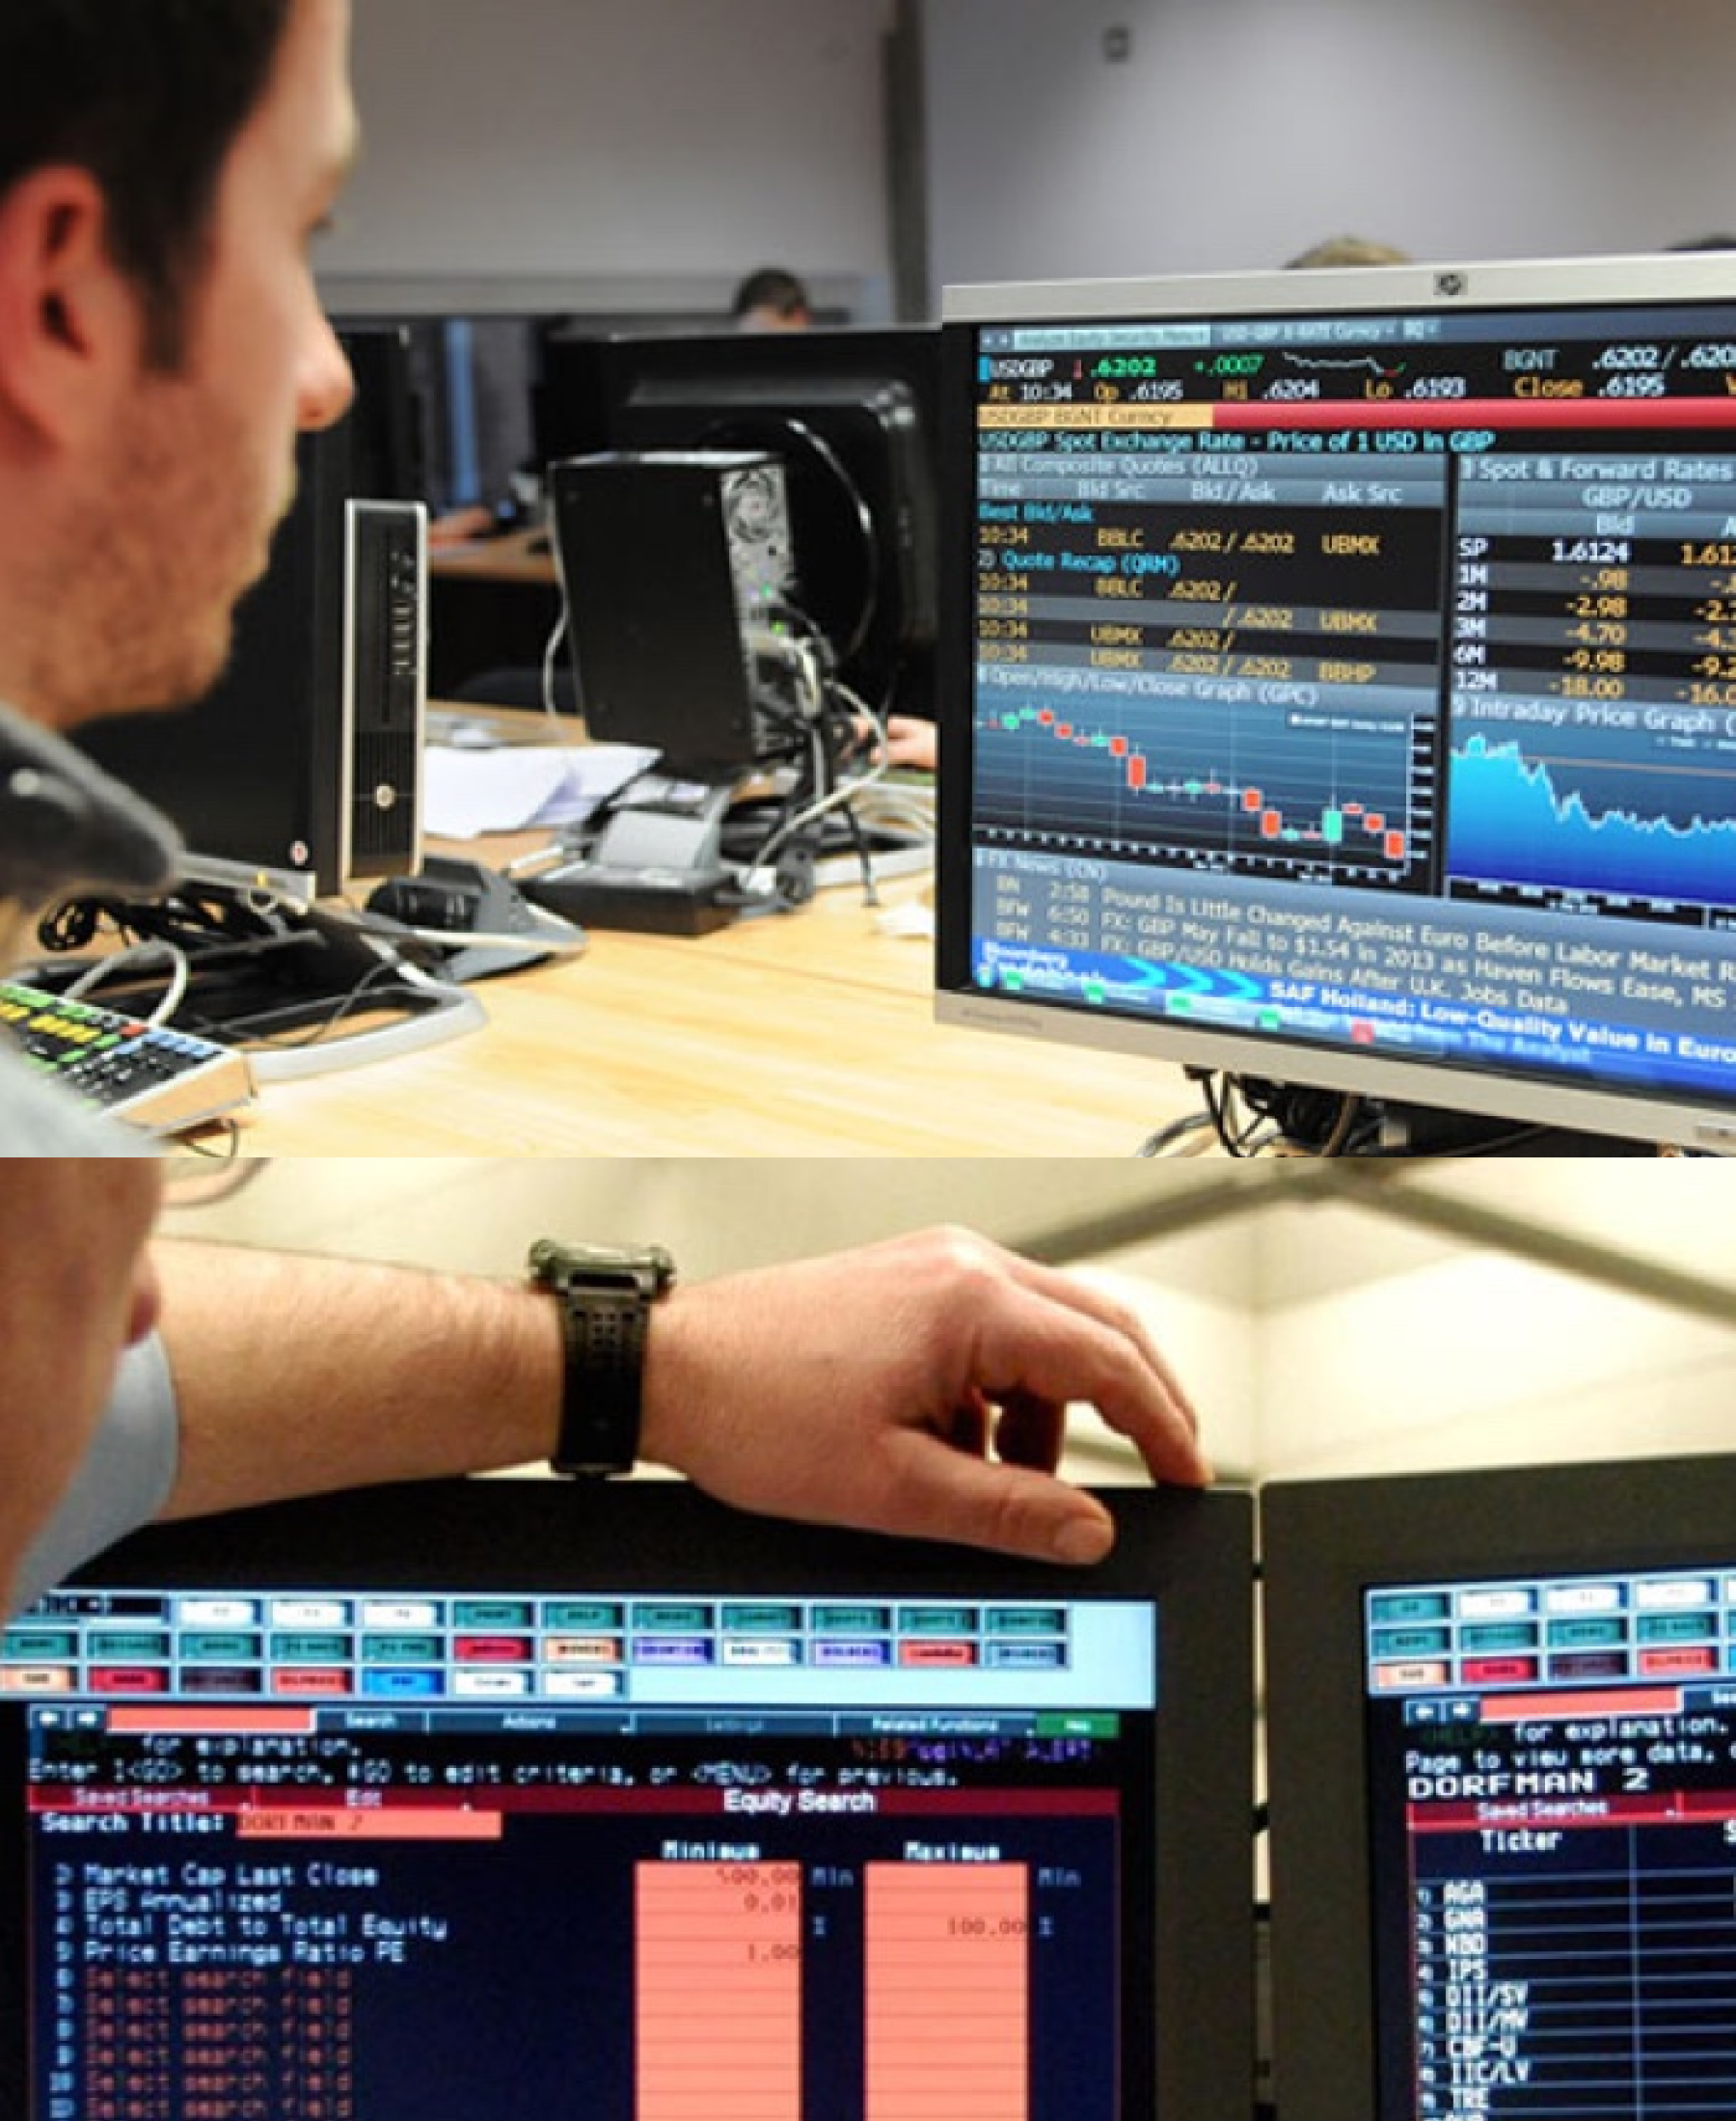
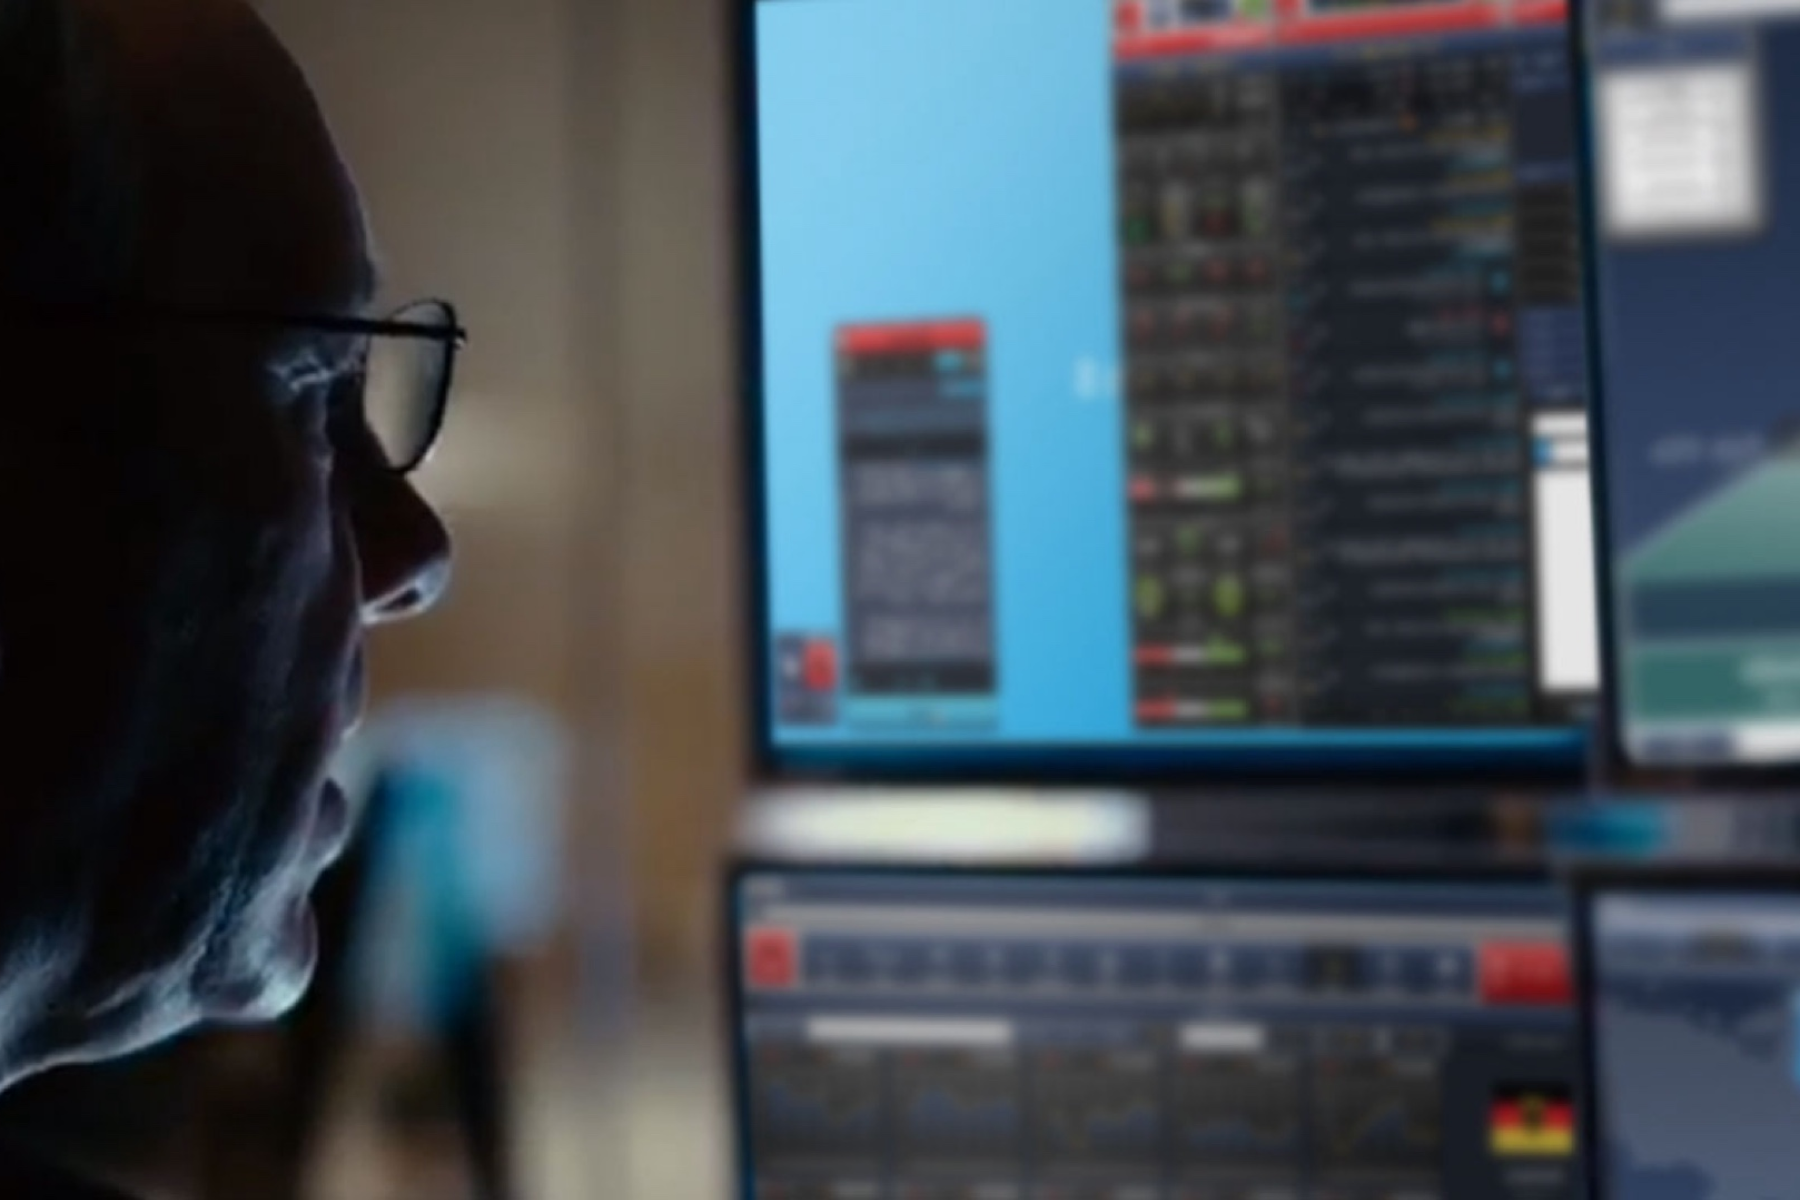
Trading floor
We were granted access to the trading floor so I immediately took the chance and planned for UX techniques to better understand the finance world.
To achieve that I used contextual enquiries and ethnographic research to understand the actual user flow and imagine how an alternative could be integrated into their daily routine.
The average Equity person
The results from the observations make me understand that Users that works in finance are technical, goal driven, with a very little time to loose during the working day.
They are also very adaptable in overcoming the problems they find using the different financial softwares (average of 5 per user), creating bespoke workflows with various tools to compensate what their softwares couldn't provide.
Picking stocks should be a no-brainer and managing clients relationship should be a easy as updating contacts on the phone.
Research
I partnered up with the Product Manager to create a clear overview of the user and business needs before delving into the project, we started with a competitive analysis to understand the market, and than I led the UX research by doing contextual enquires and leading focus groups.
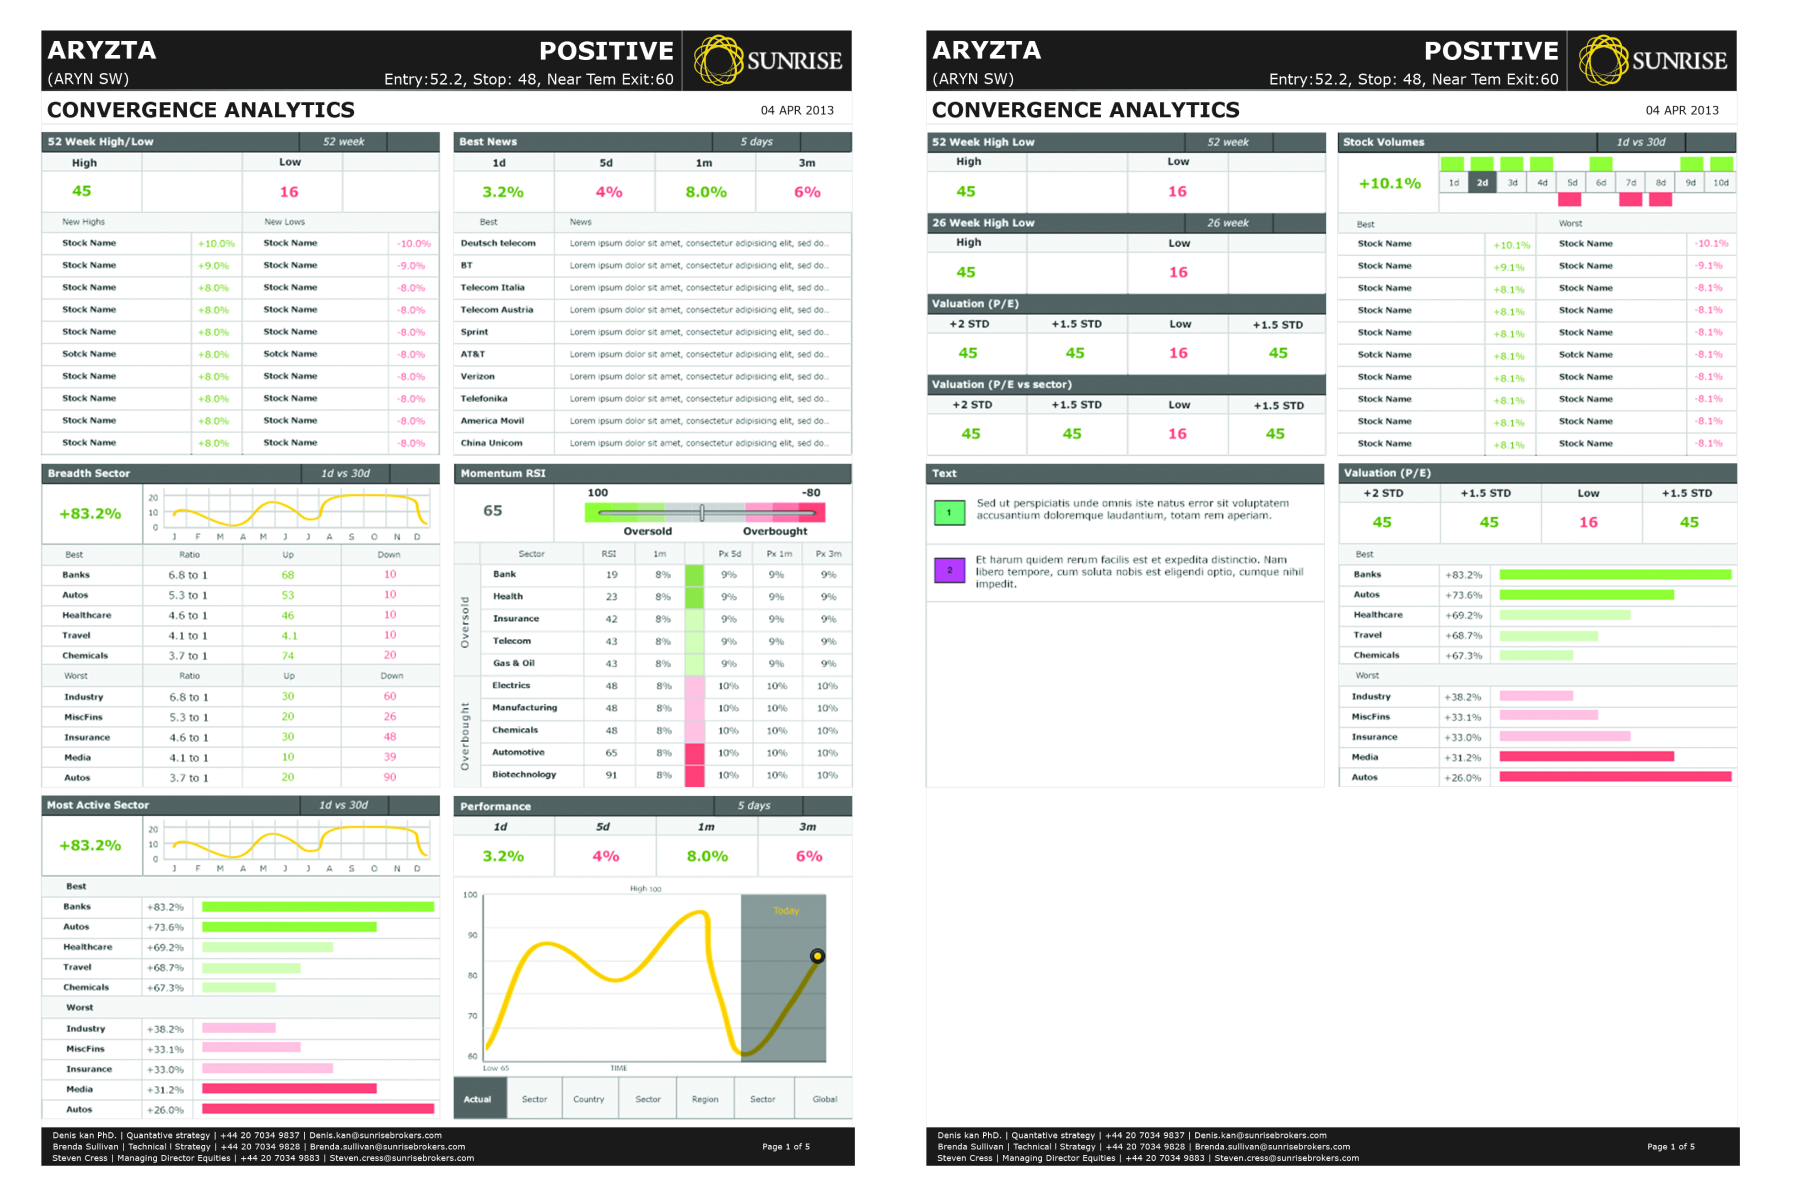
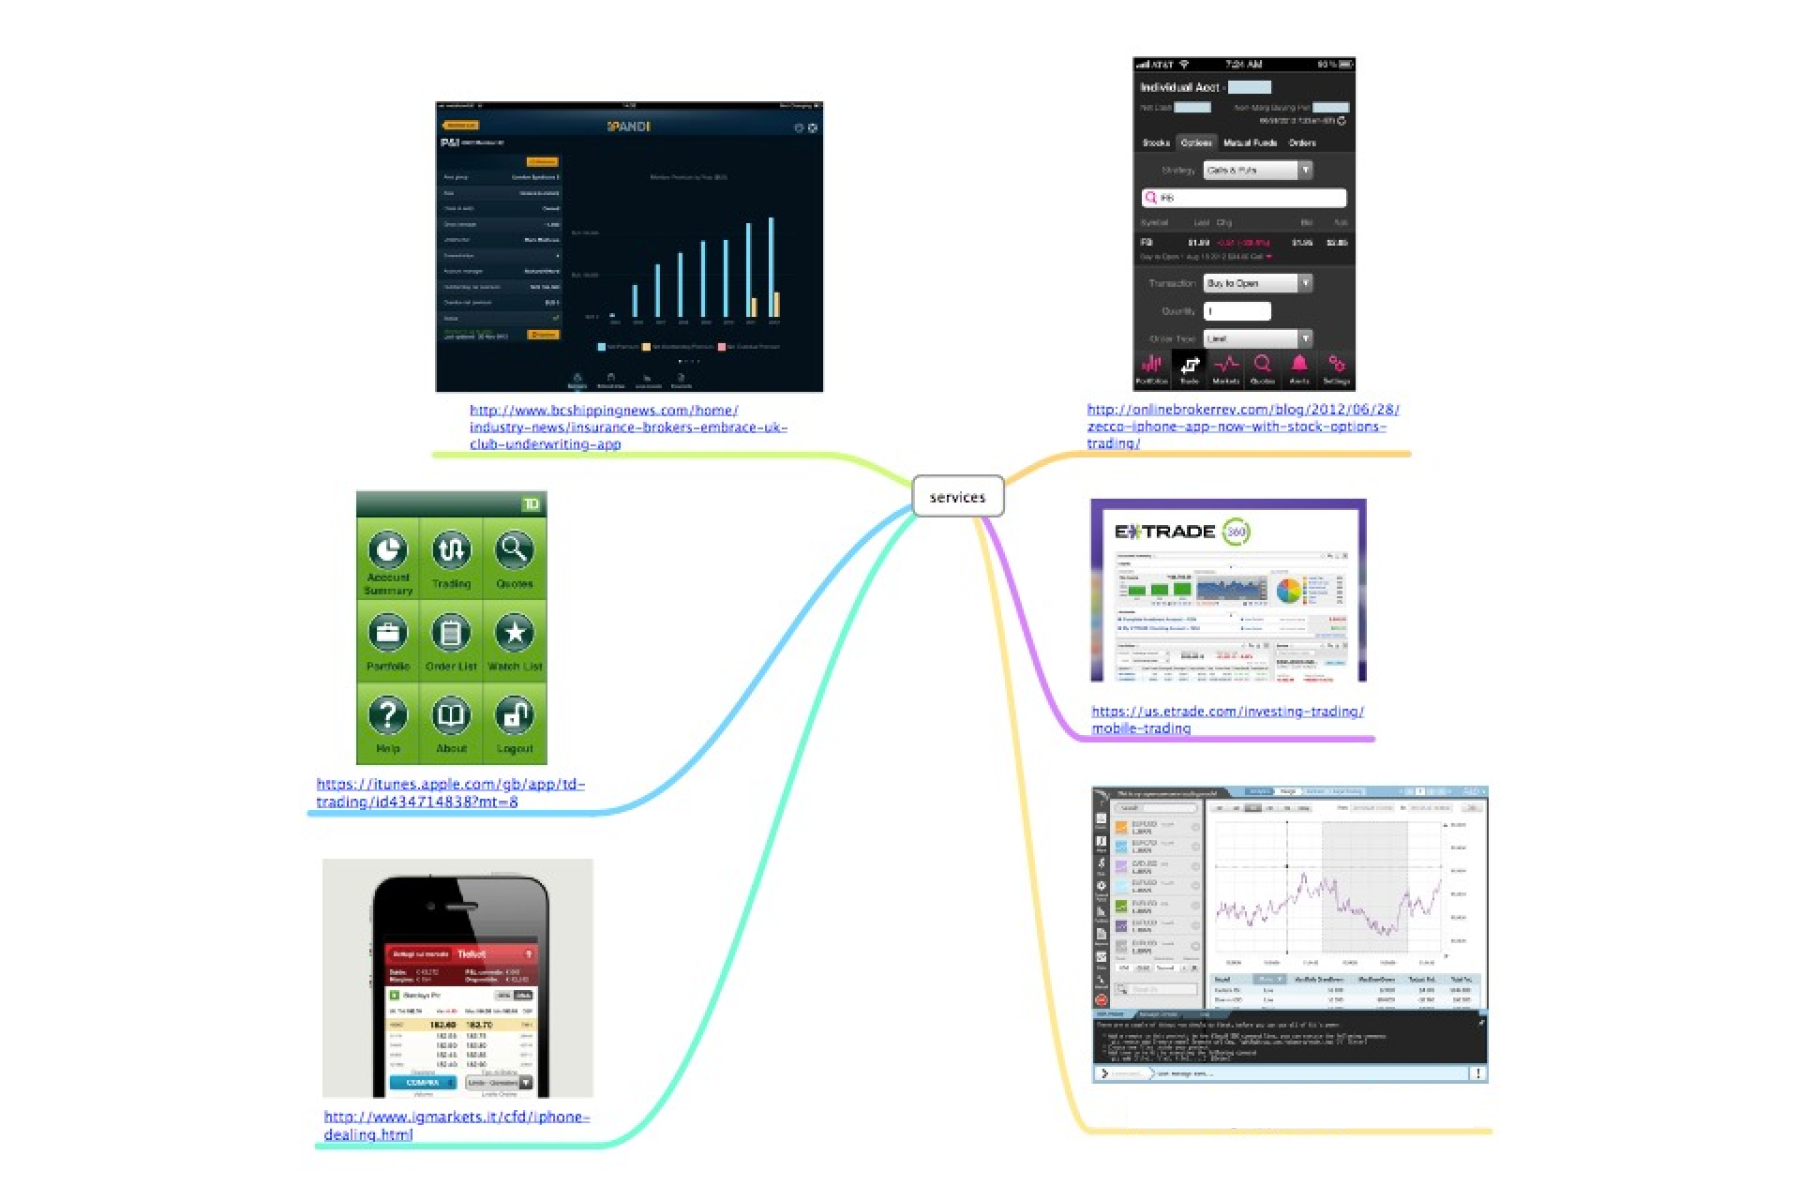
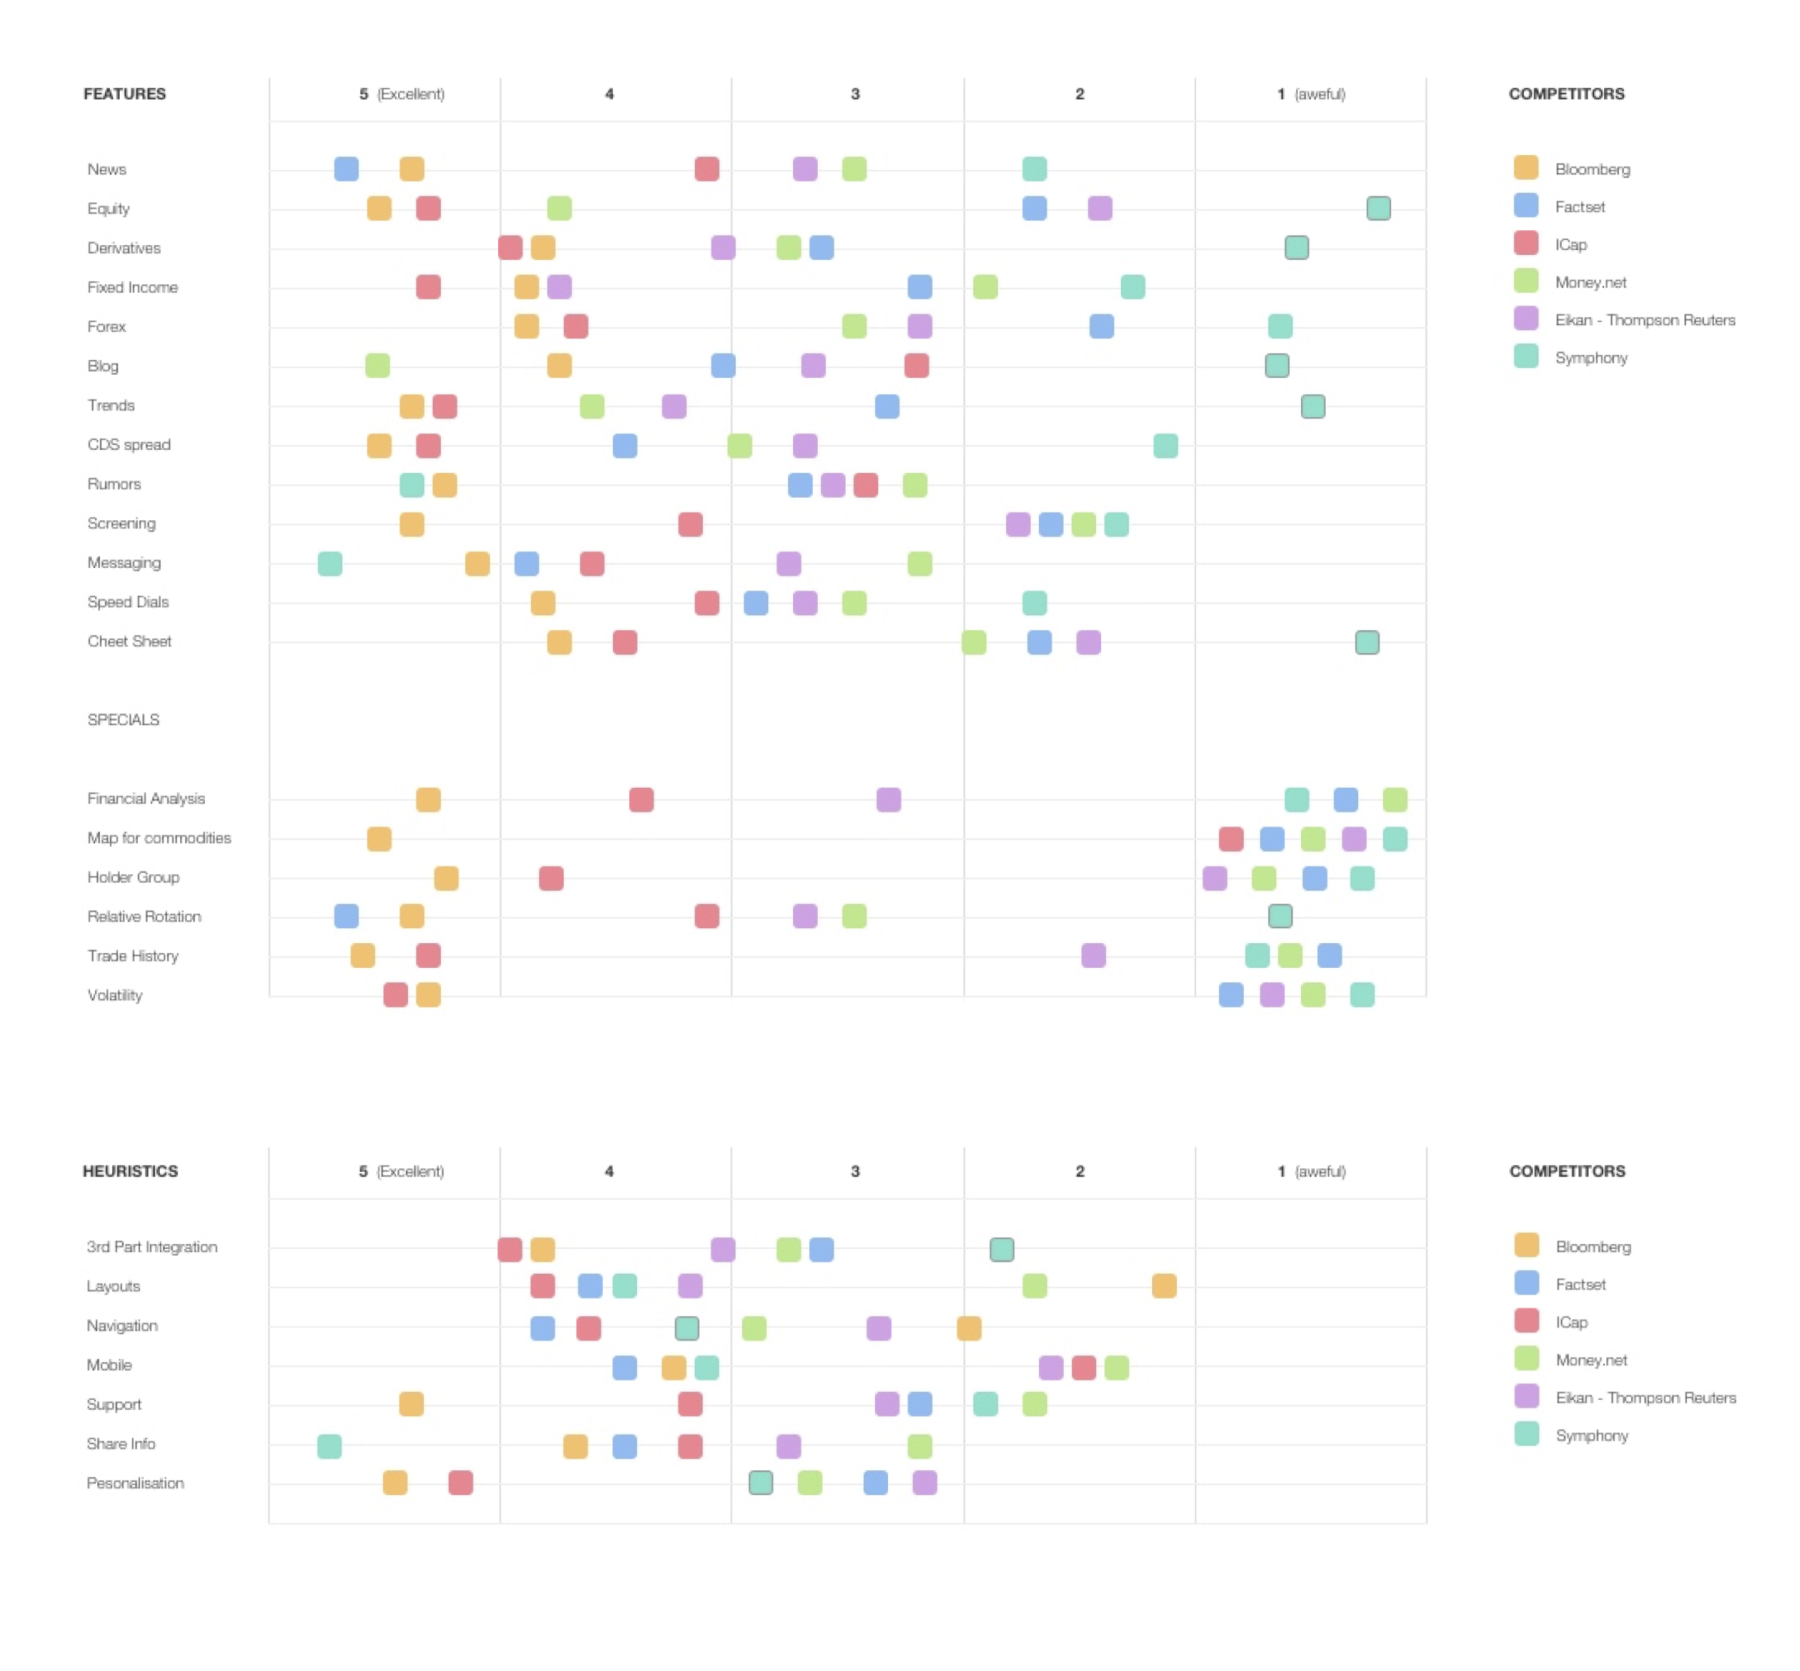
Competitive Analysis
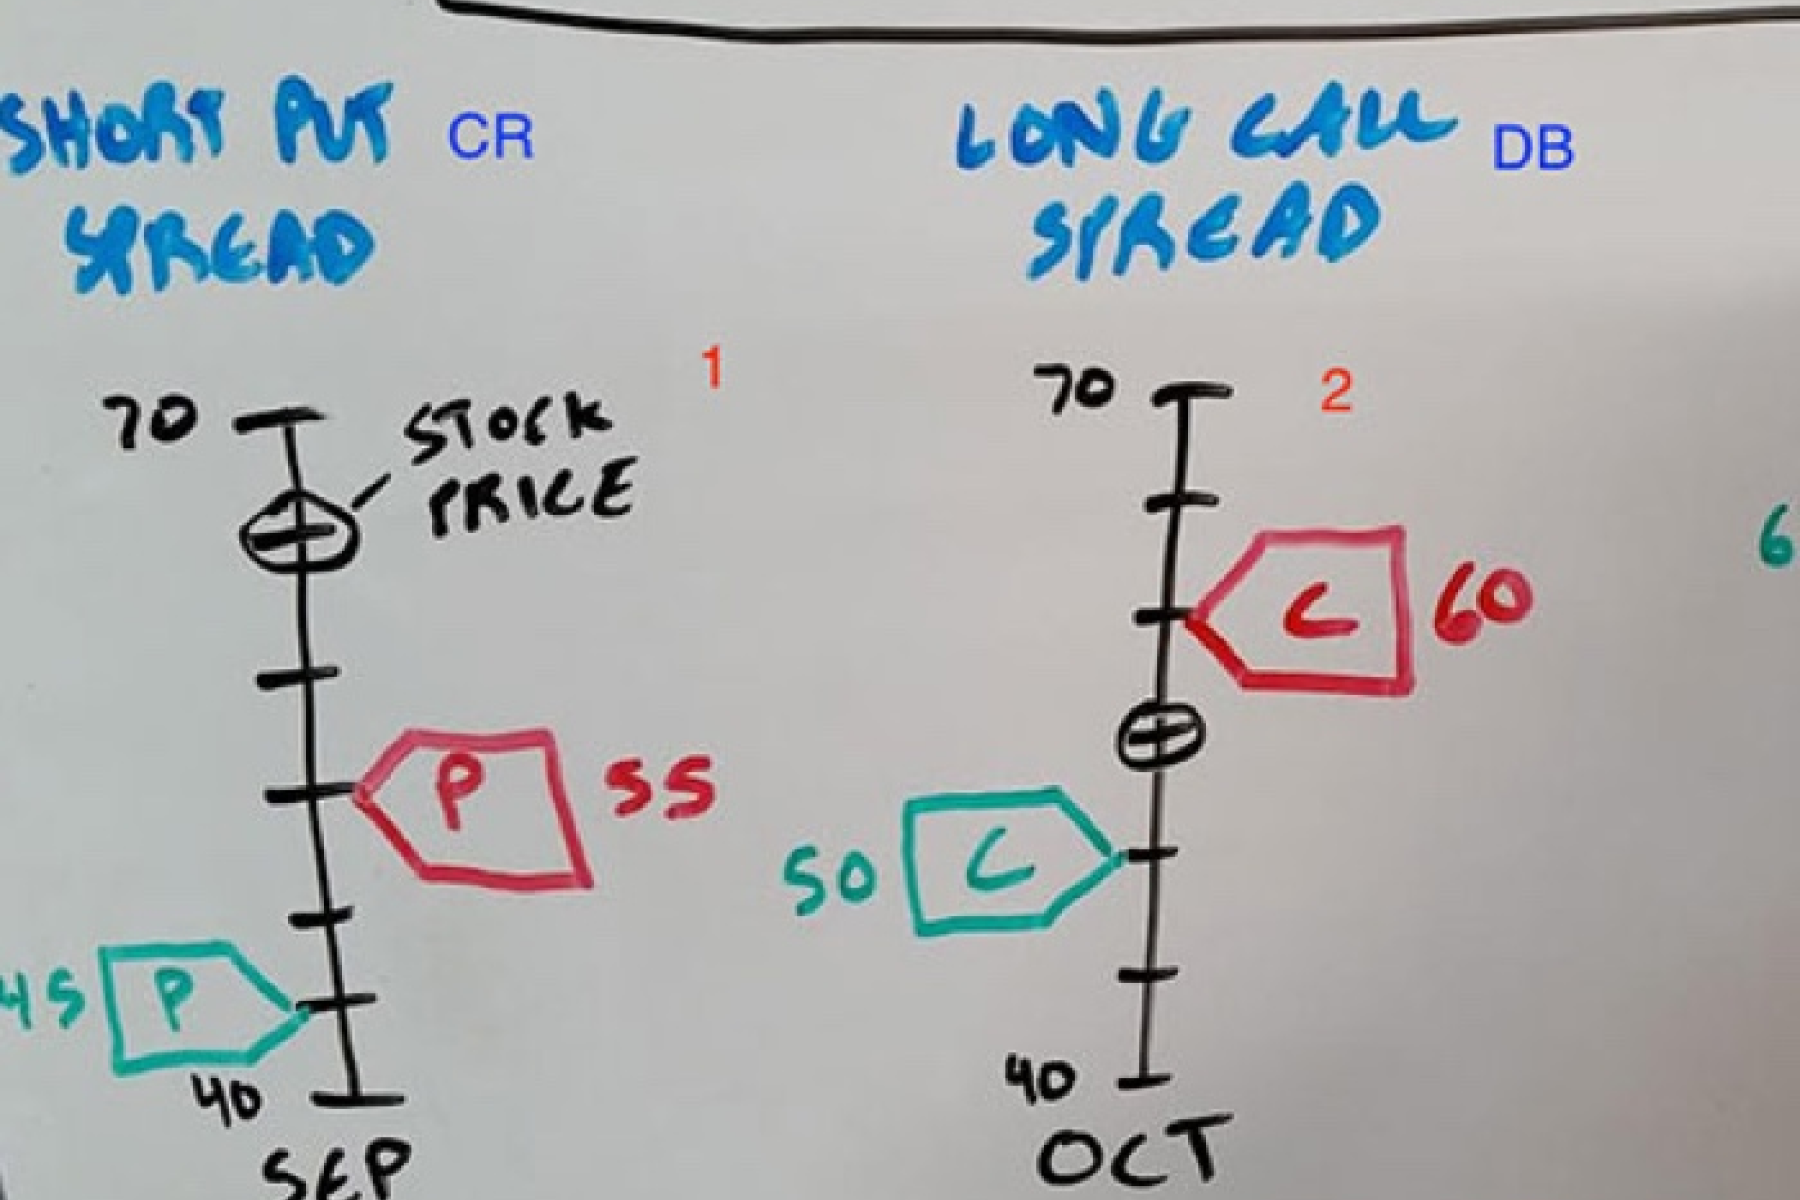
To approach this huge project I had to select a UX strategy that helps me get data and KPIs before starting the analysis of the problems. I believed that each component of data had to be aggregated, enhanced, analysed and personalised to discover actual problems into the different flows of users. This started with competitor analysis and task analysis on competitor's software to understand values and problems and decide red routes of development.
I had to learn how to use a couple of financial platform to create the competitor analysis document, and brokers helped me understand & use with confidence the specific vocabulary these stakeholders use on daily basis.
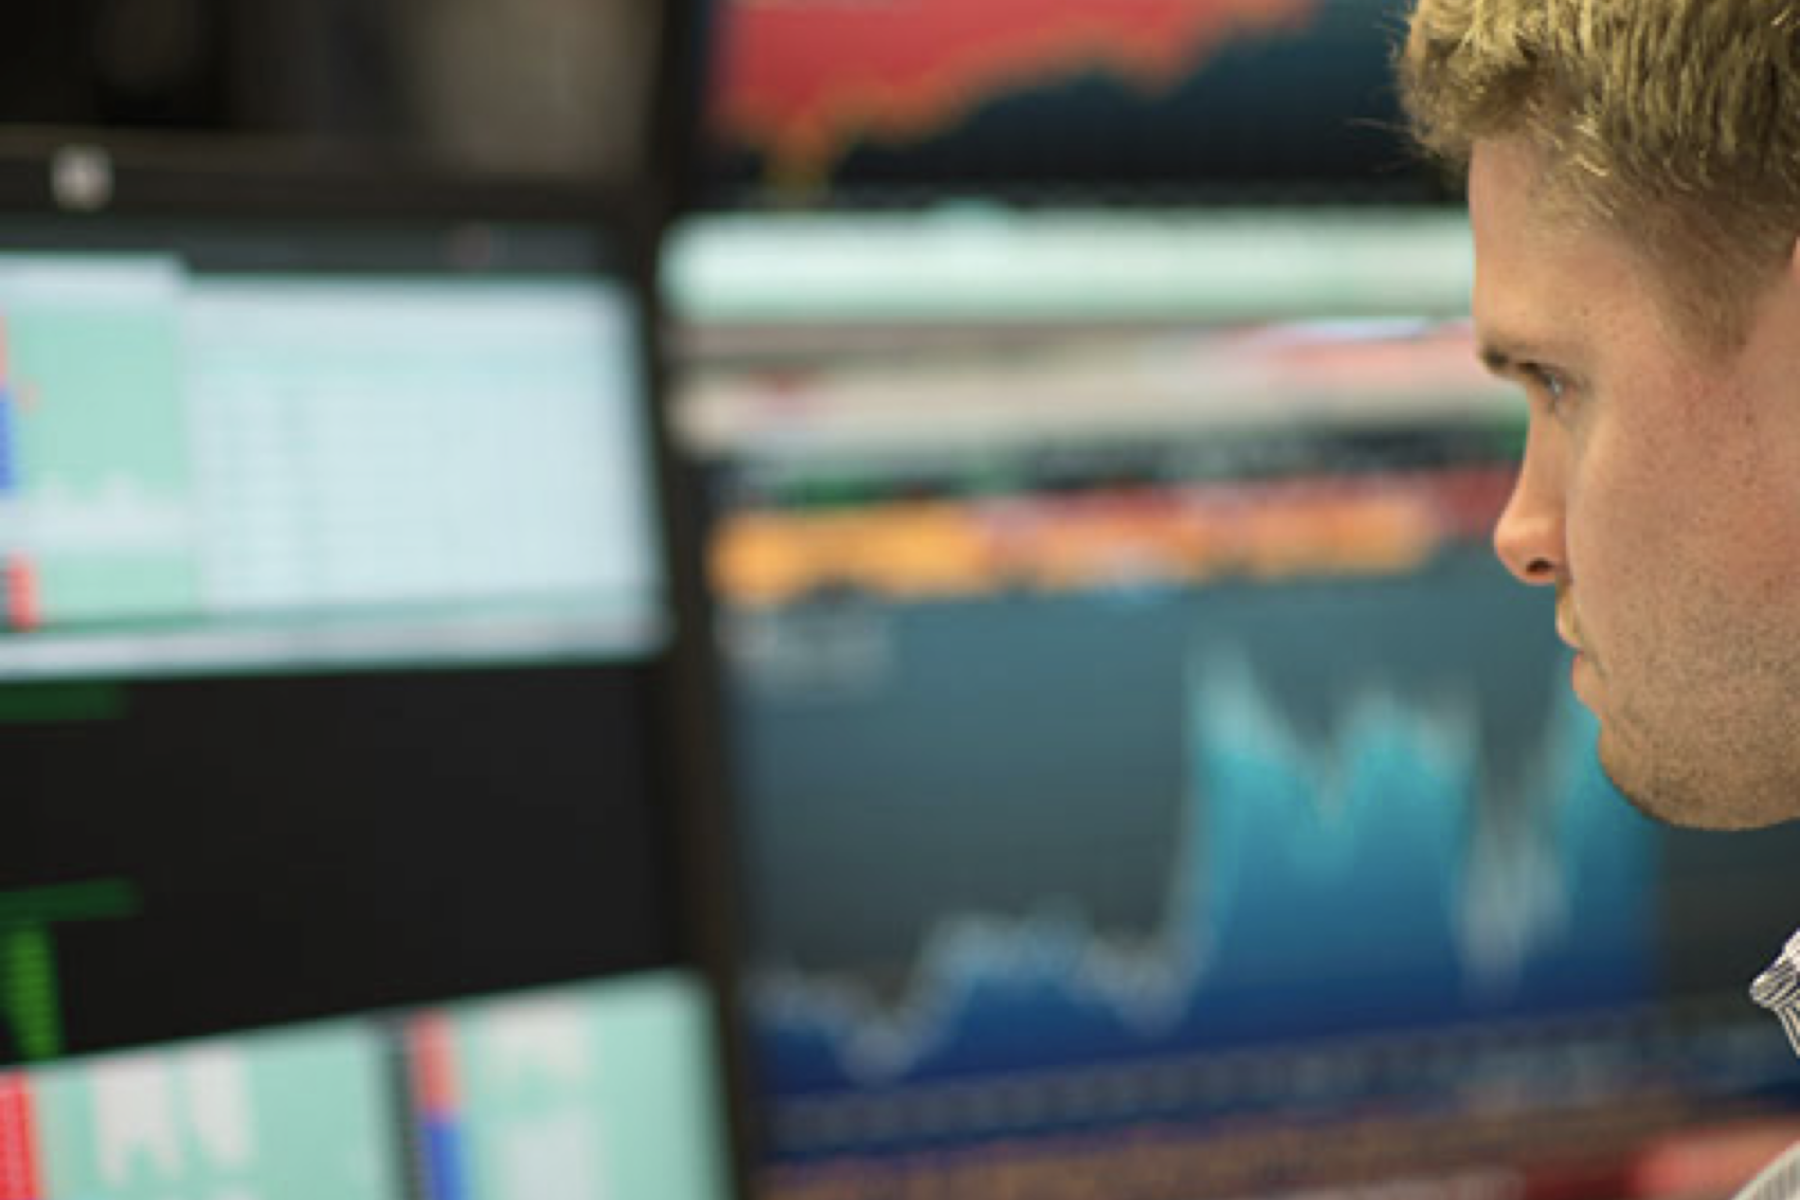
Contextual Enquiries
Thanks to contextual Enquiries we were able to have a full immersion in the users’ world and understand properly the complex and deeply fast working day of a trader. Then we asked a few users to answer questions for the most intricated workflows to understand better the single steps of each one's process.
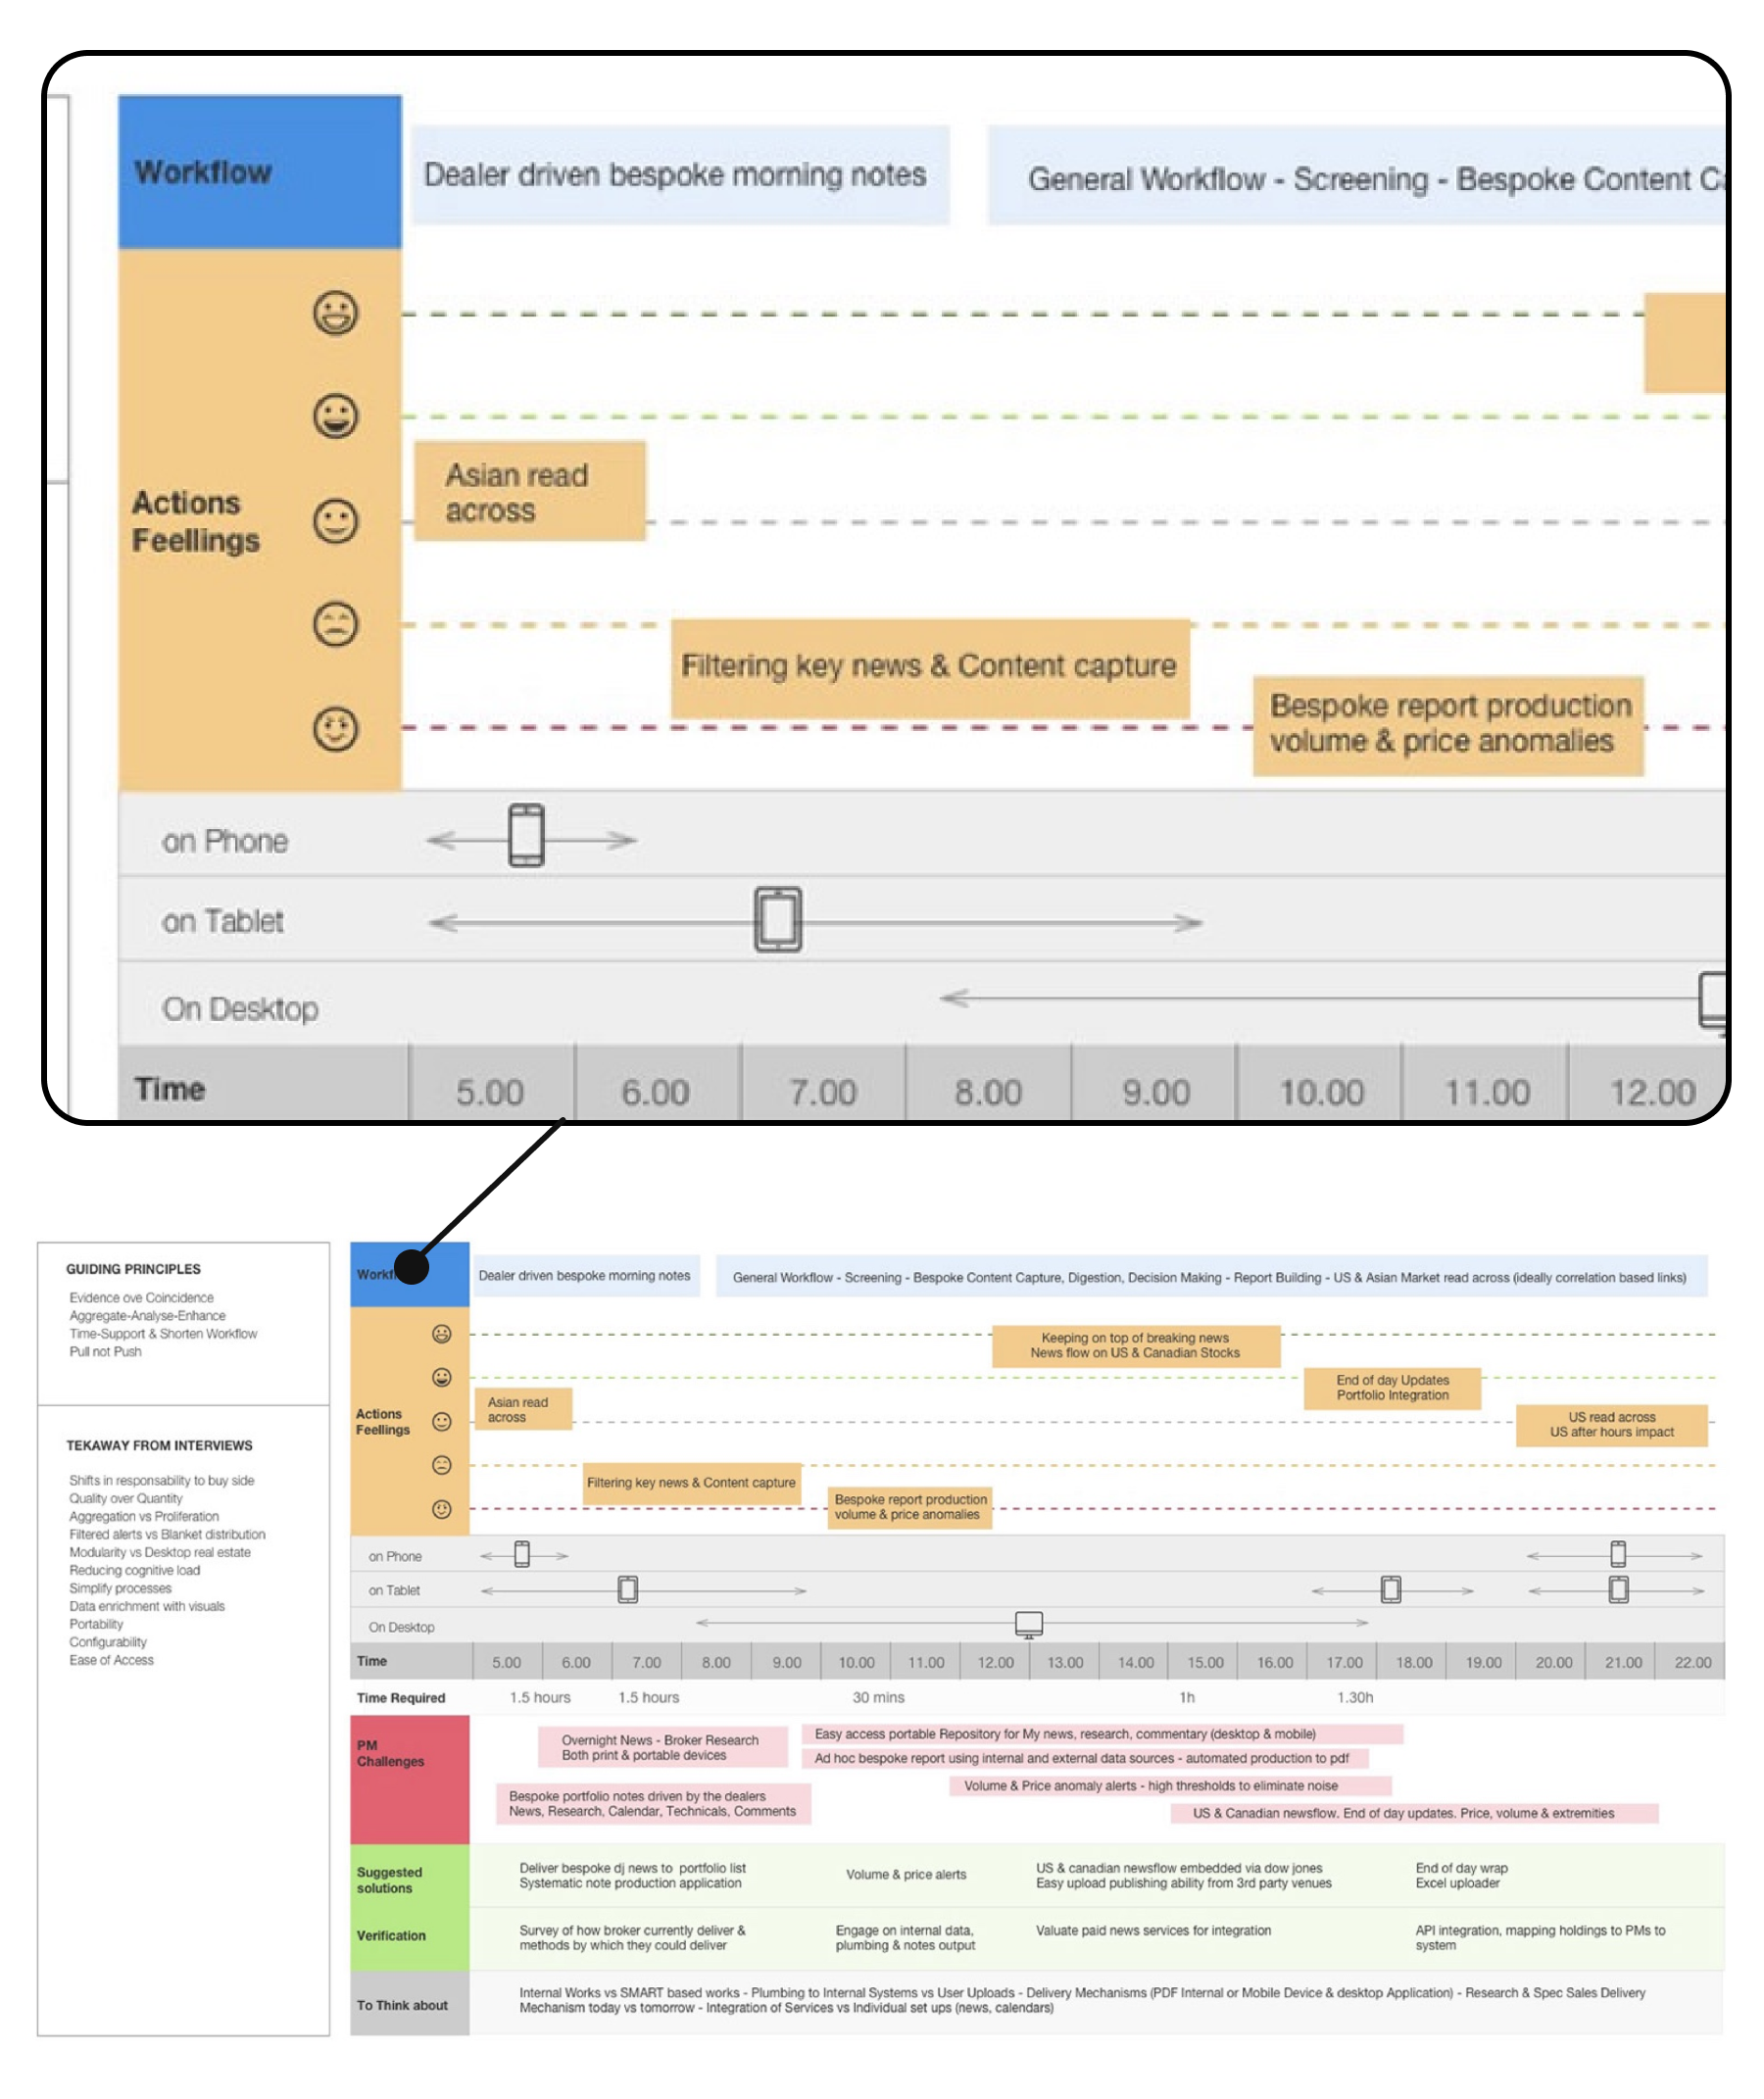
Focus Group
After the contextual enquiries me and the PM took around 8 people and we went through the main step during they workflow of everyday life. Then we compared 7 different workflows to see if there were something missing or something in common that overlaps different tasks. For example the life of a desk leader is different from another broker not responsible for the desk.
The chief may have to be away from the desk during meetings for quite a long time during the day and is less interested in following every second the news and chatting with the guys to close trades. So the chief is interested in an overview of his colleagues, while keeping track of the behaviour and decisions of his team, and on the other hand the broker need just to take care of his clients.
Help Equity Desk
Streamline the trading process, enhance real-time decision-making and improve overall trading efficiency.
Help their Clients
Have a better picture of the market, make more informed decision and stay within their risk tolerance.
Help Company
To increase client satisfaction and retention, thereby driving business growth and reinforcing their reputation.
Deliverables
We had to present deliverables and choices to the board to show how the project was evolving and to aligning with evolving business needs such as the request of integrating it with their blotter and OMS.
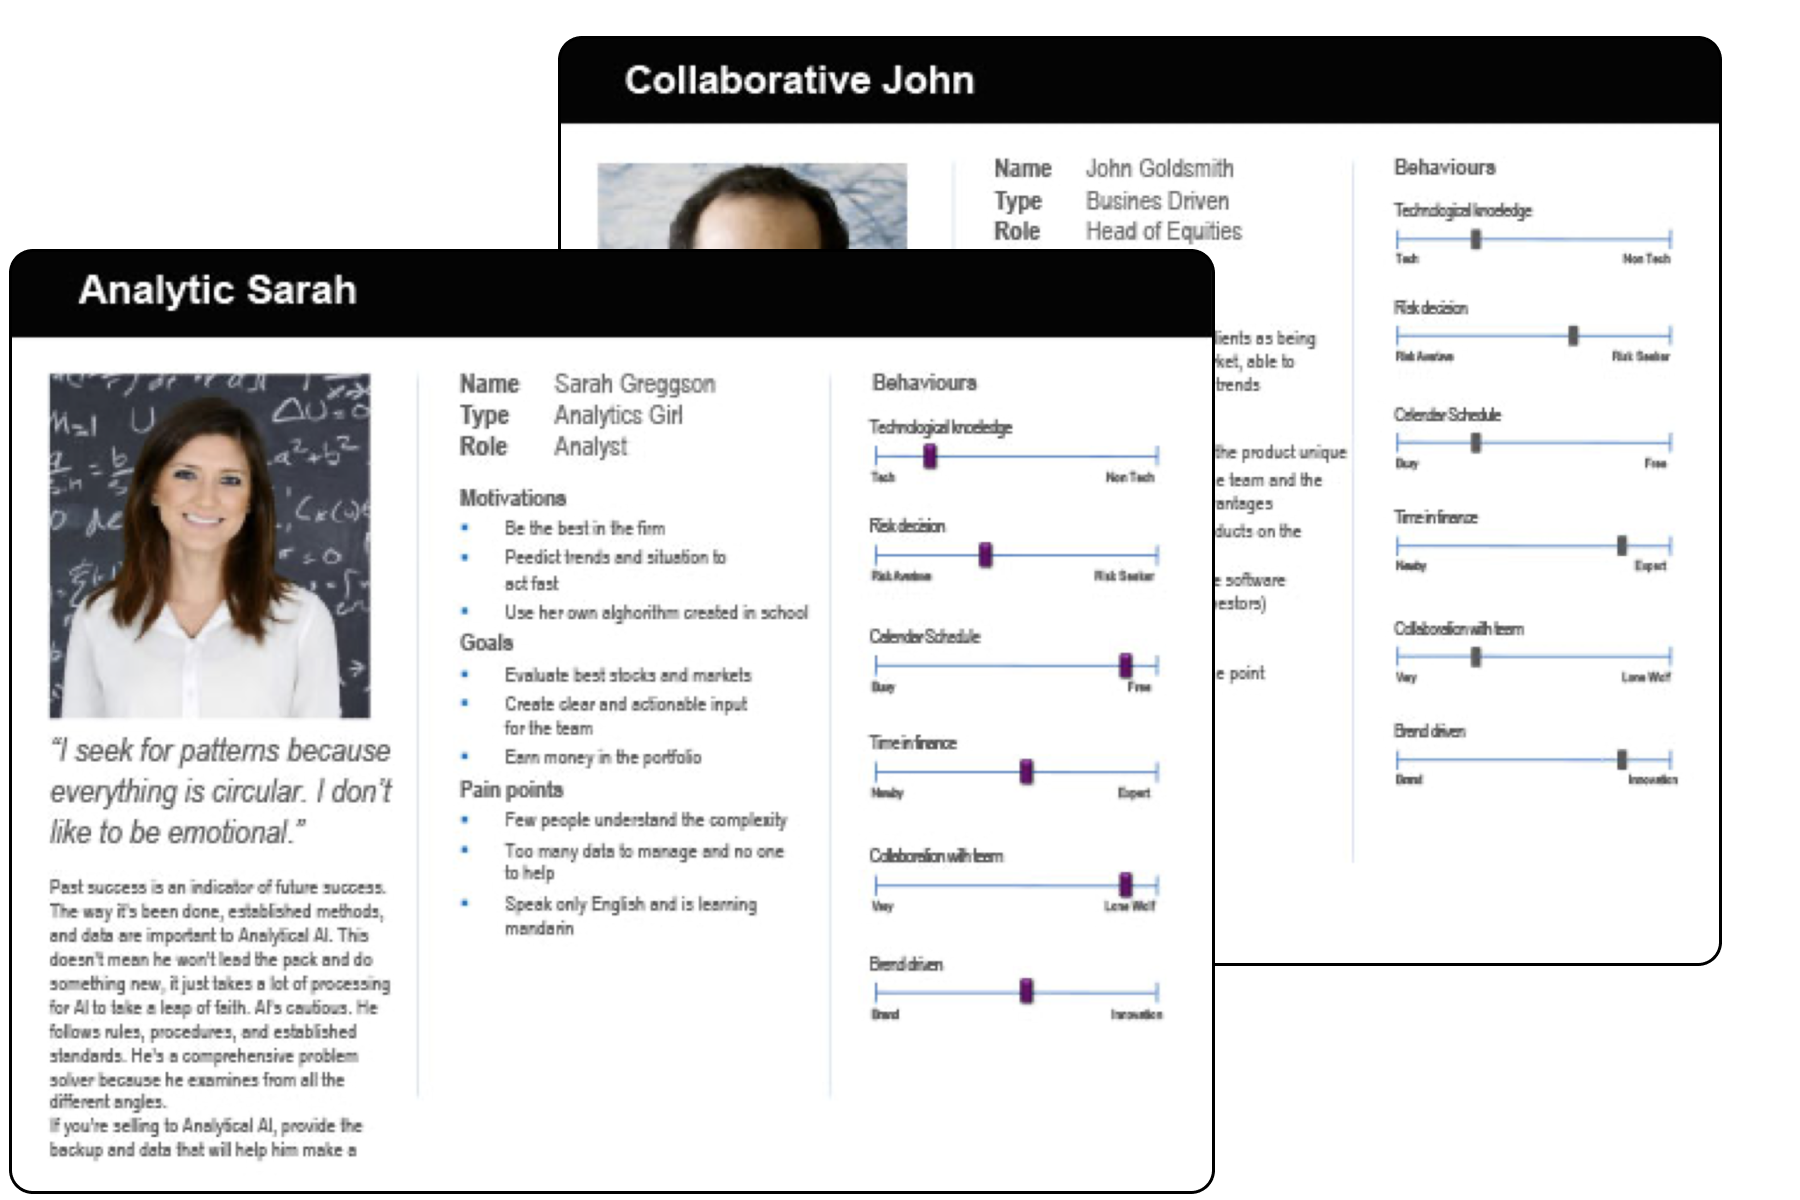
Personas
After competitor analysis and ethnographic research, I started to develop personas that will have been our target users during the development of the platform, to help the business being more strategy oriented in catering to each audience, internalize the customer that we were trying to attract, and relate to them as real human beings.
The results from the persona clustering and development results in the definition of 7 main stakeholder for both buyer and sell side: broker, dealer, analyst, portfolio manager, desk leader, investor, client.
We focused on the 3 more important: broker, investor, desk leader.
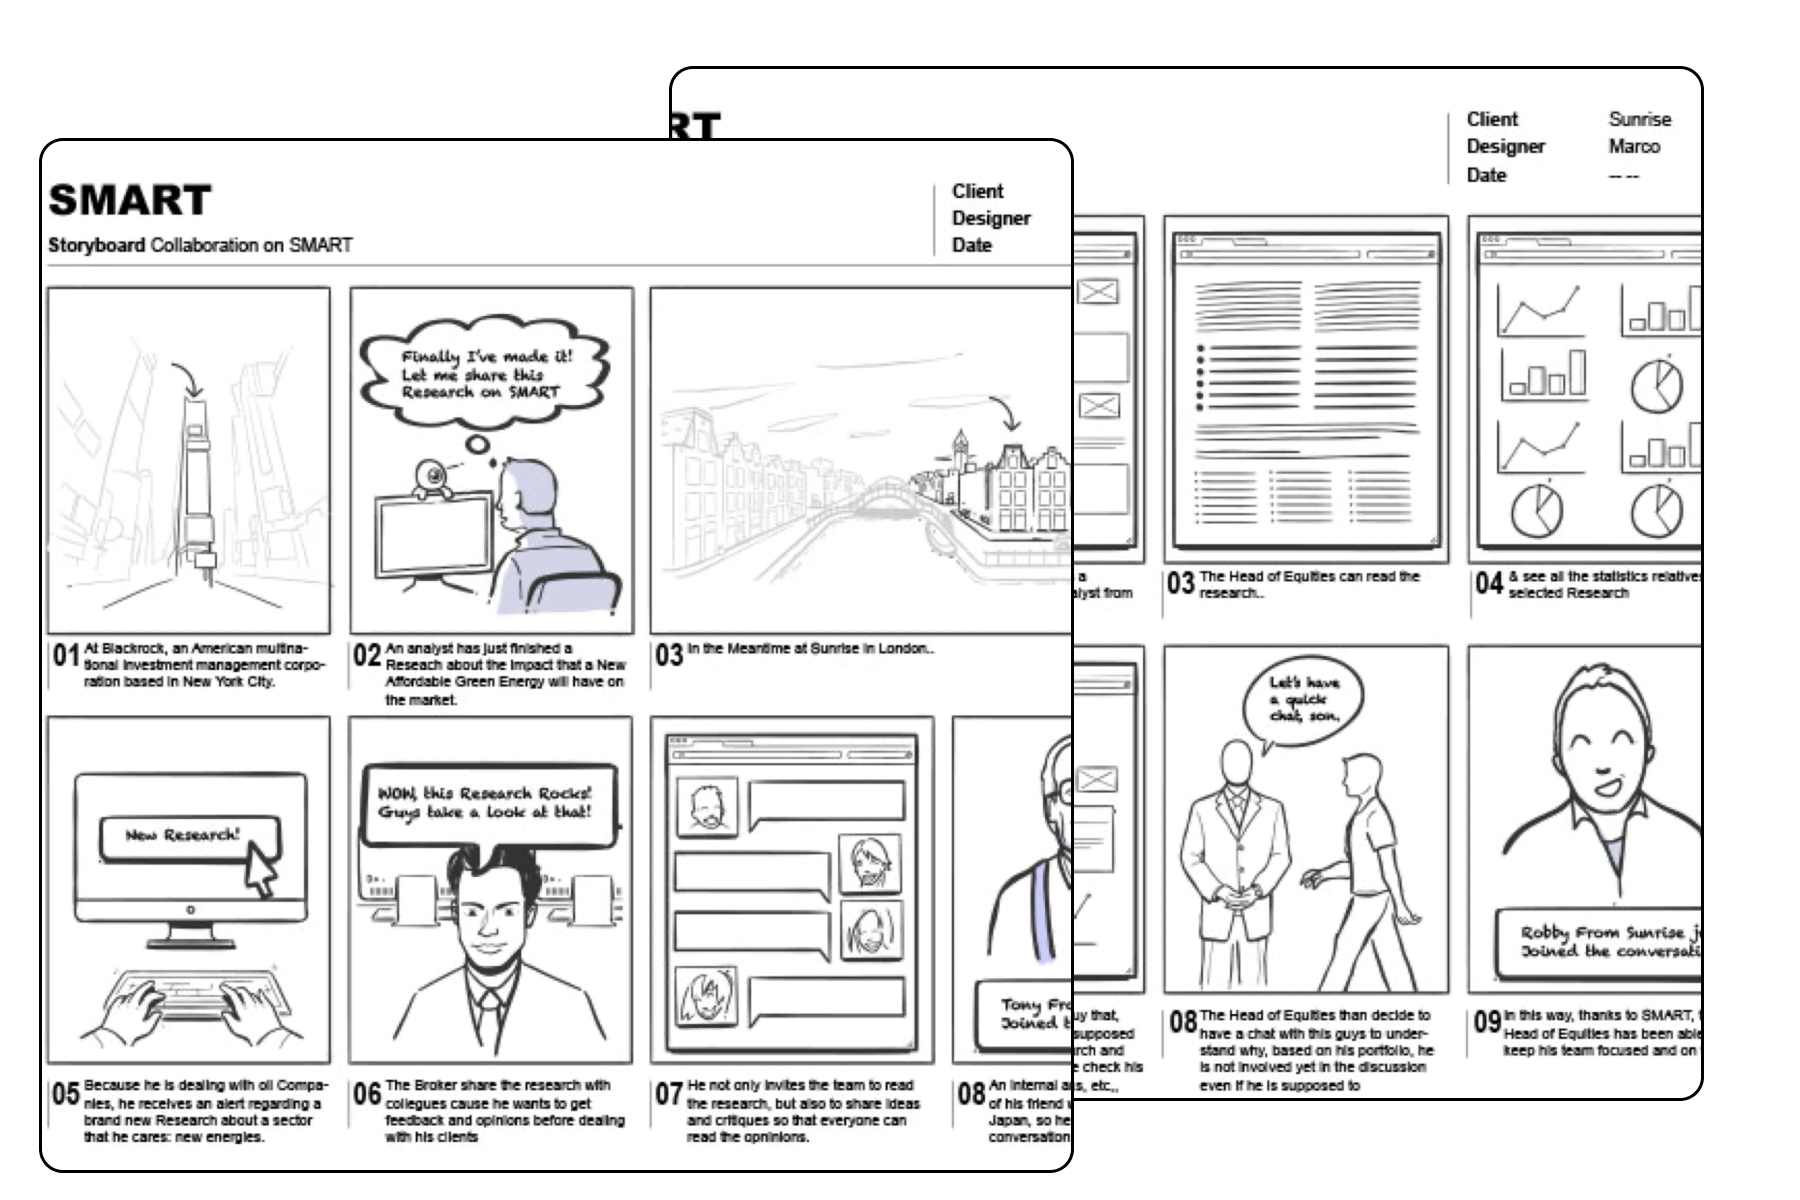
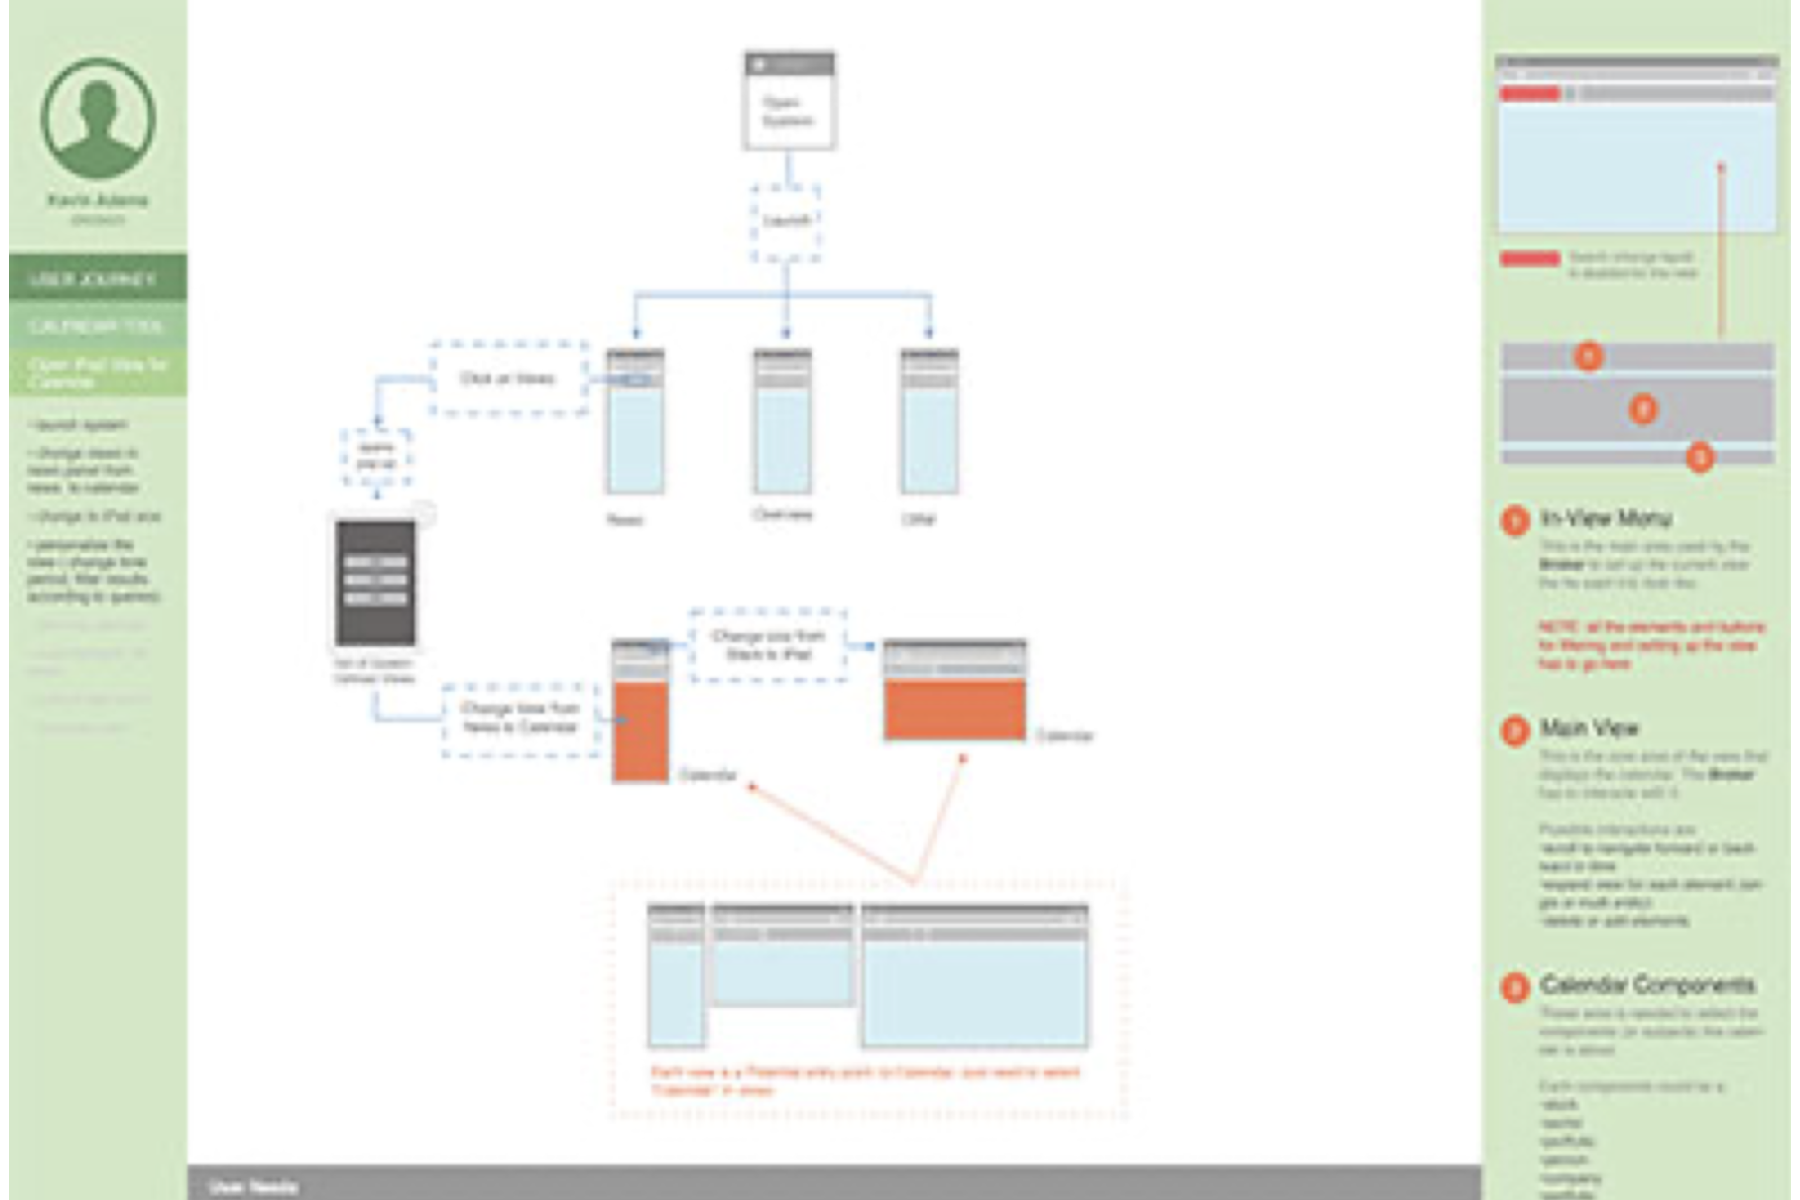
Scenario
With the development of personas I've also developed scenarios based on the personas and the red routes, to create real working situations and understand main user flows that the product should have improved.
Decide
Streamline the workflow of users by providing integrated, easy-to-access market insights and client data, enabling faster and more effective decision-making.
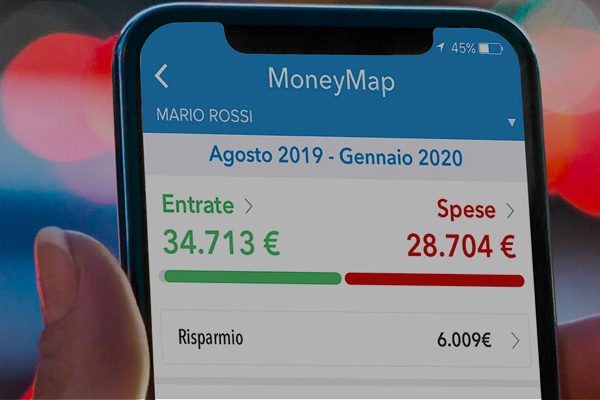
Simplify
Empower clients with user-friendly tools that simplify data comprehension, ensuring that the equity desk can quickly answer client's doubt and help them understand market dynamics.
Scalable
Business want to improve operational efficiency and grow our market share with a scalable solution that is integrated seamlessly with existing systems and enhance client satisfaction
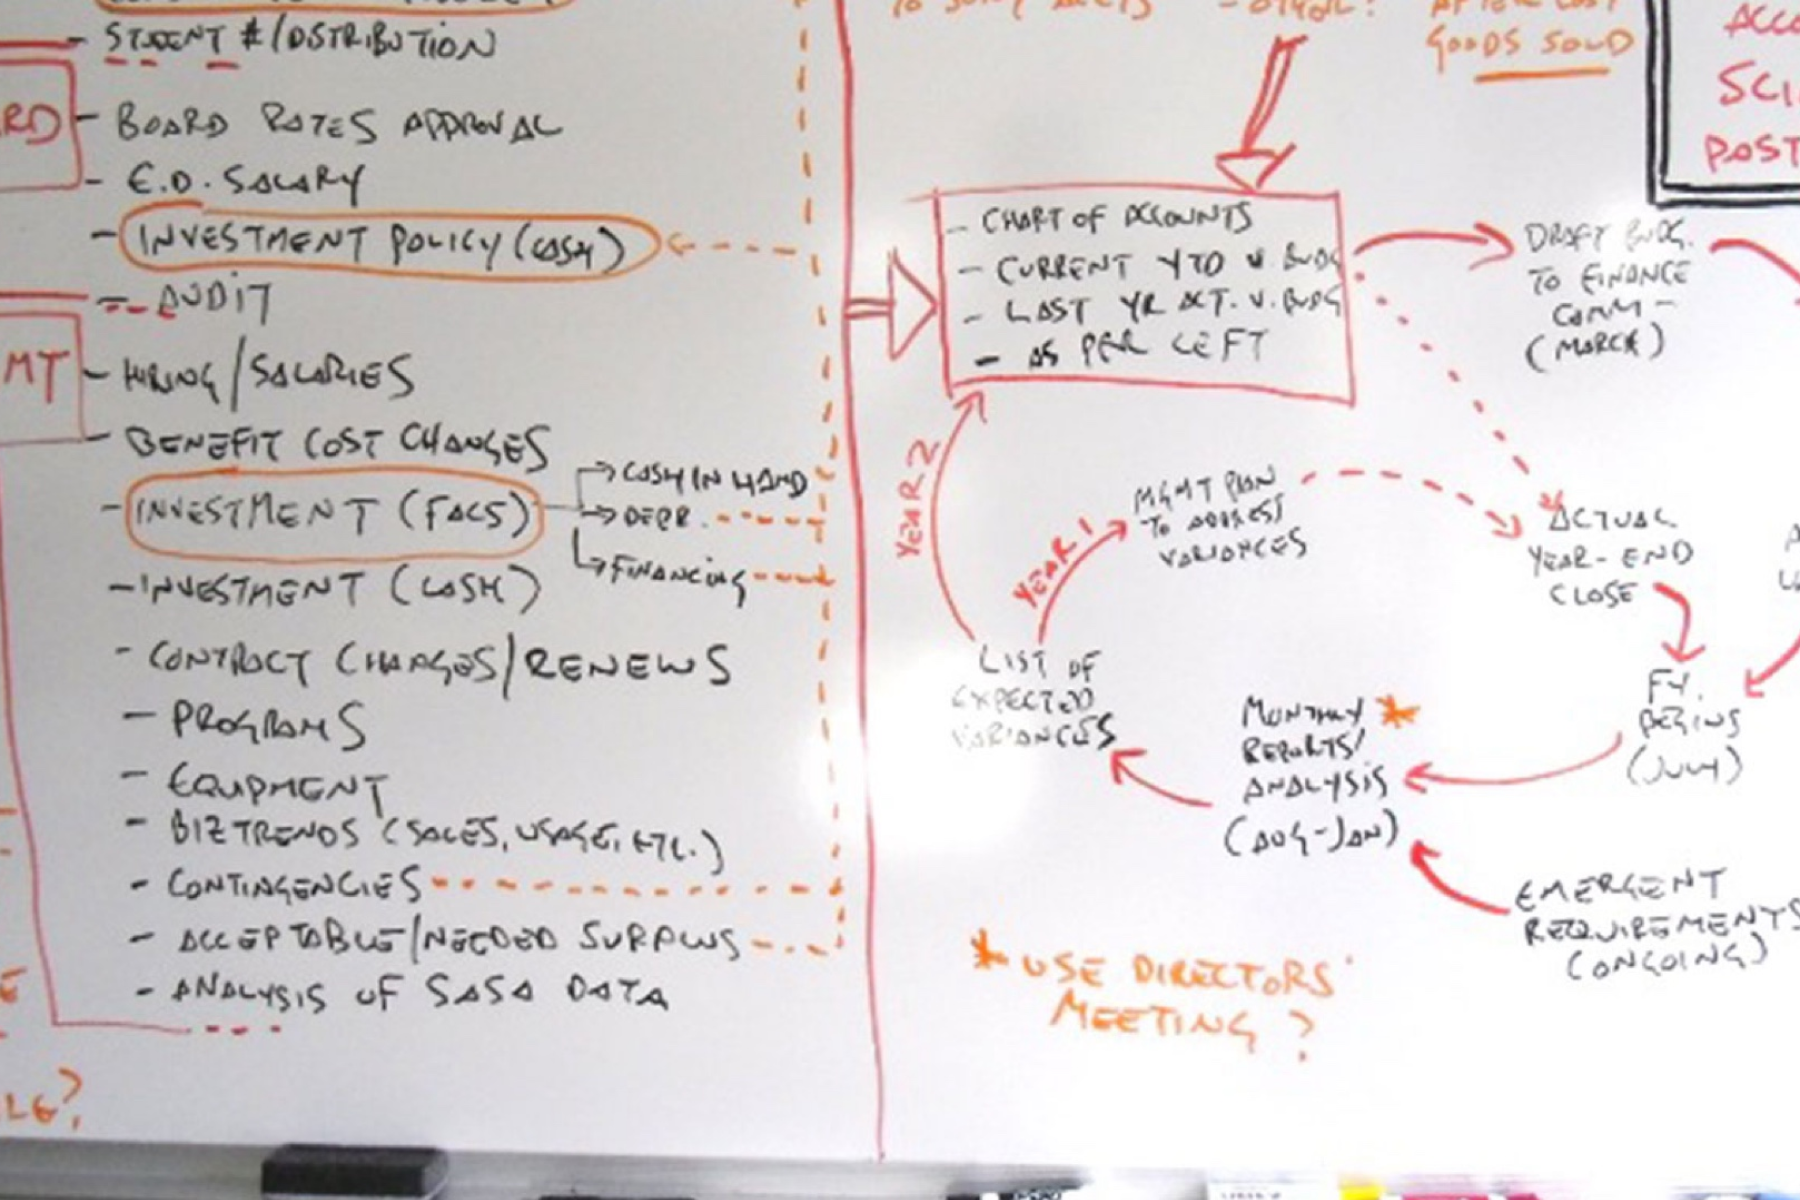
Idea generation
With the documentation from the research in one hand, and a bunch of rough ideas in the other, we had 10 days of idea generation & quick tests for validation thanks to paper prototyping and Wizard Of Oz Technique.
We print out personas and stick them on the wall to always have the real users "into the room", we used moodboards to get inspirations and ideas from various fields, Brainwriting to generate a high number of solutions for the main problems we were trying to solve in the first iteration and affinity diagrams to organize and interpret the data from the sessions.
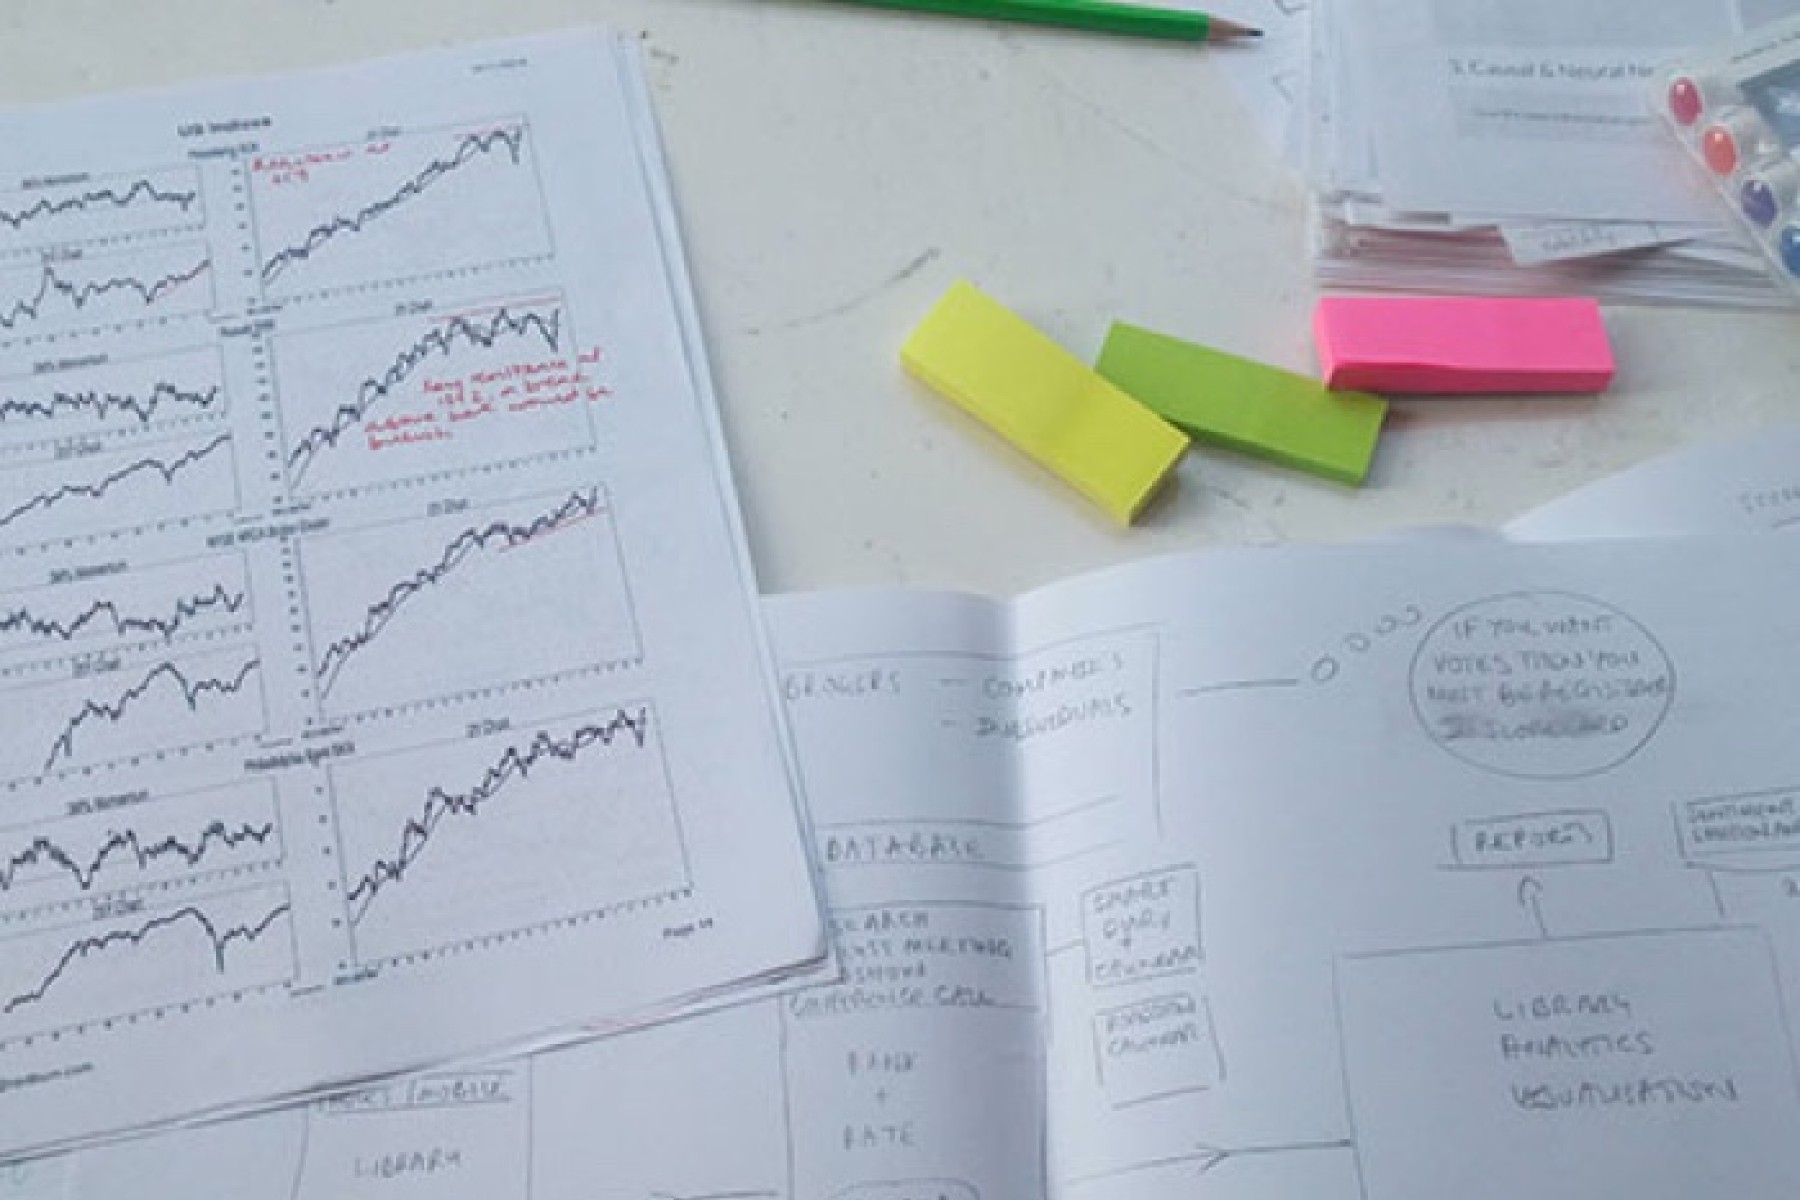
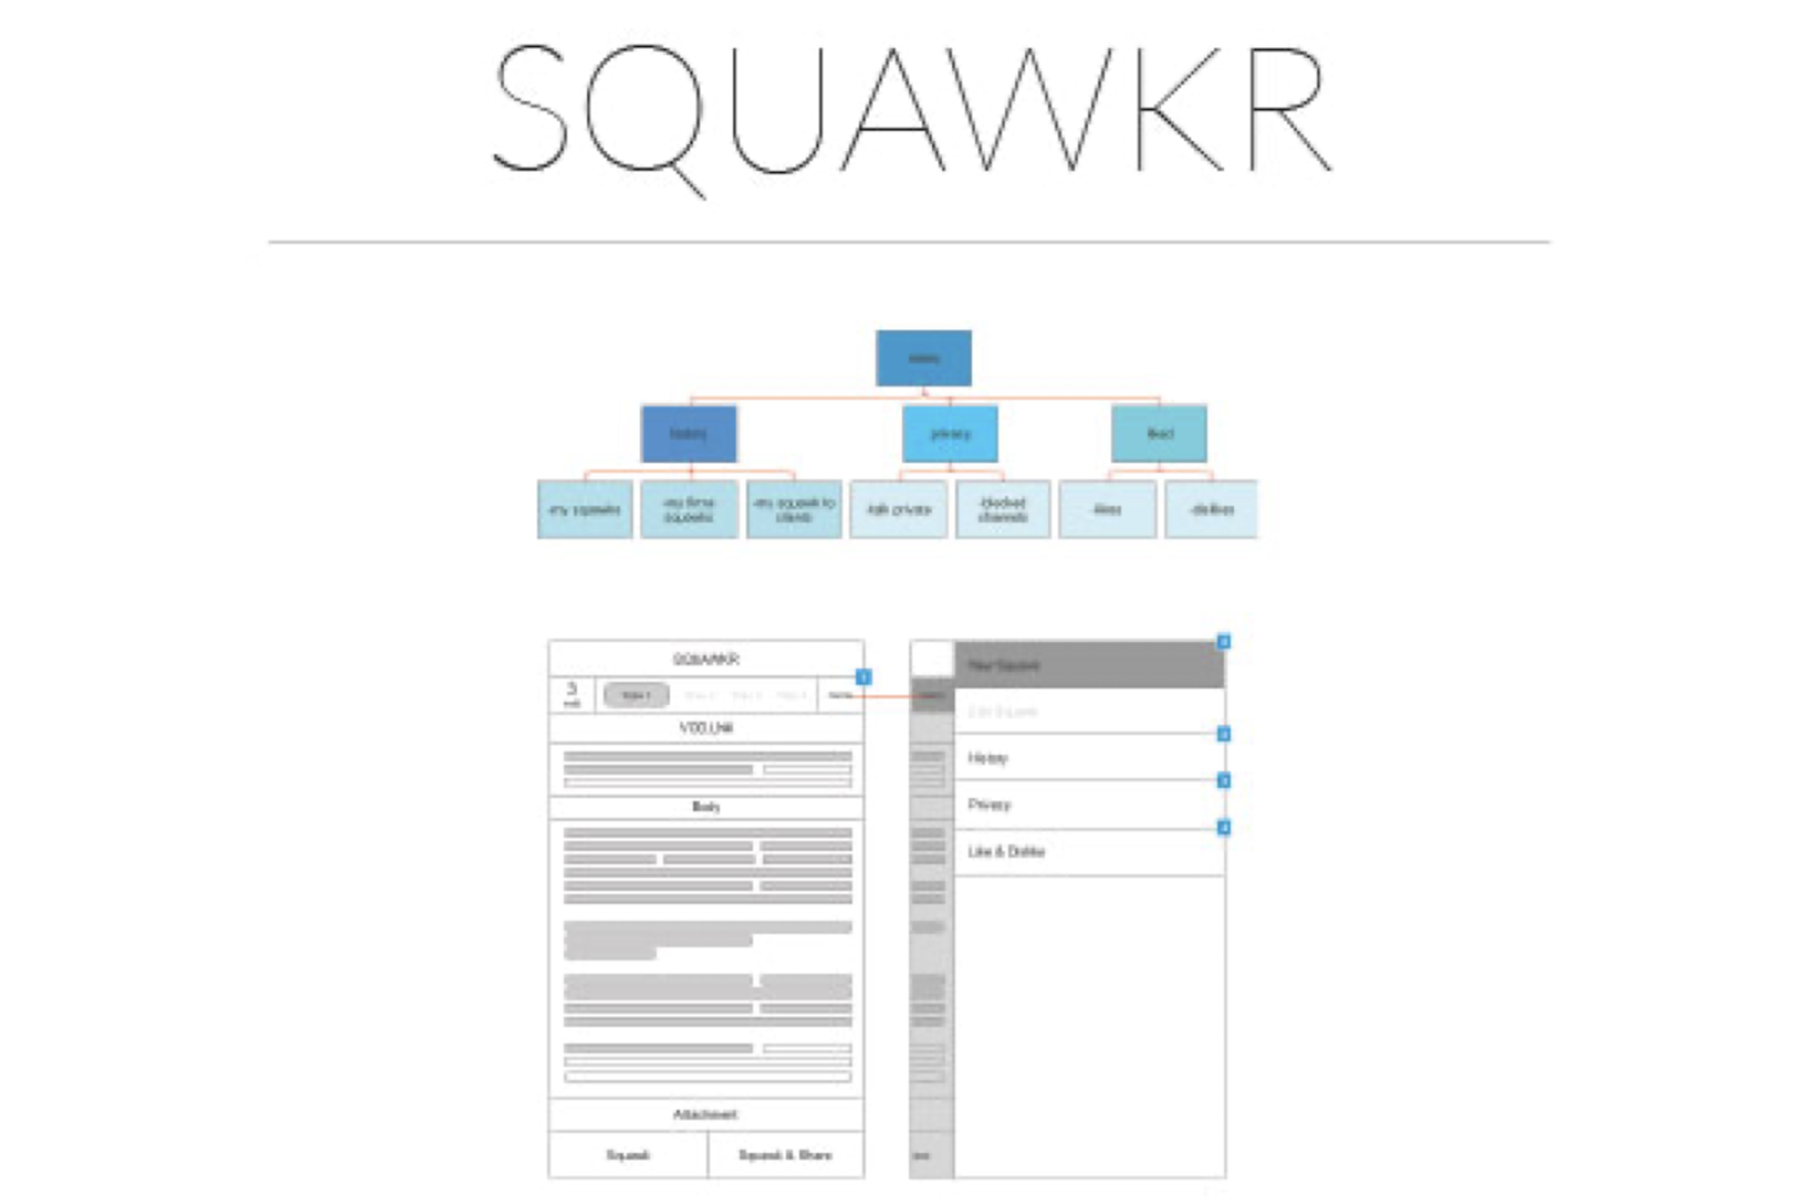
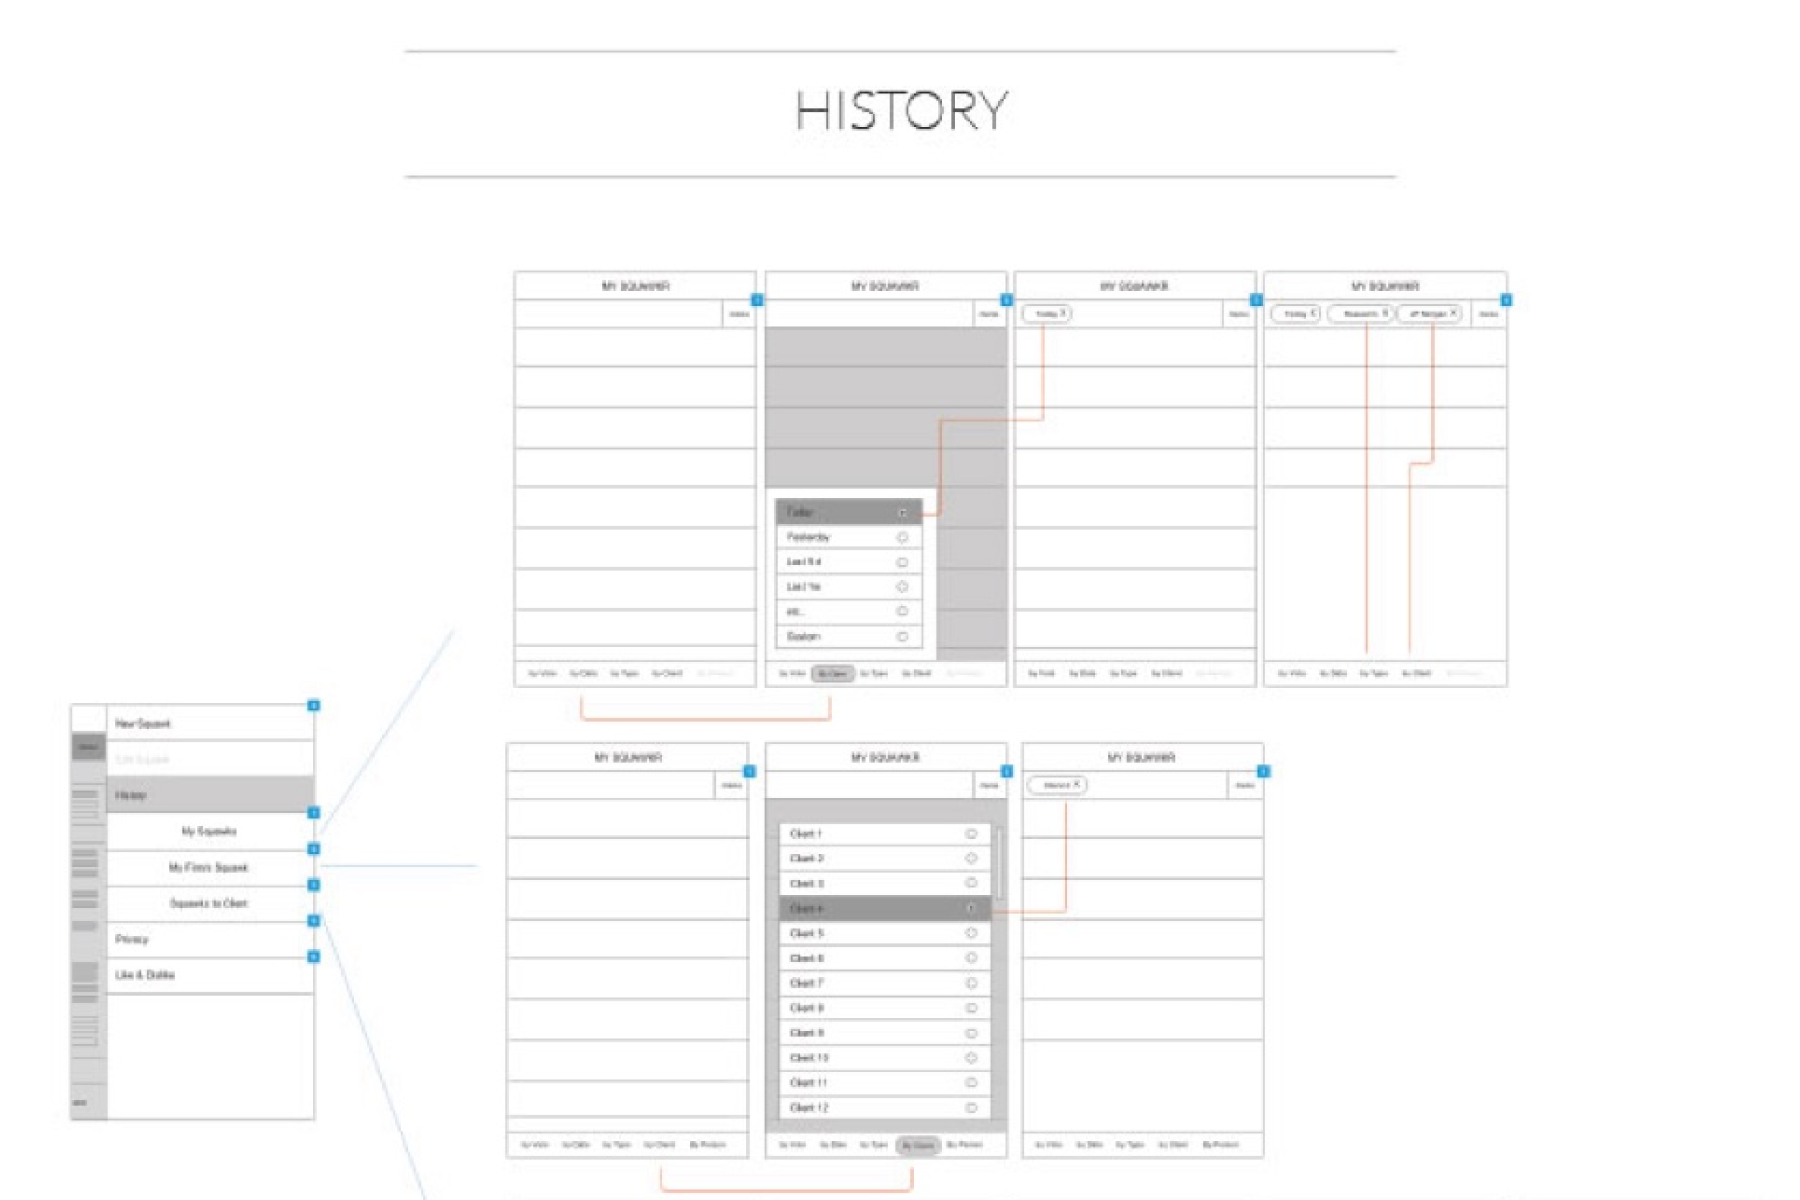
Information Architecture
To help demonstrate the operability of the ideas and before start wireframing we create a functionality map of the system and we realized that the best way to achive a product that was scalable, user based and intelligent enough to adapt to different tasks was to create small products that acted as a team when delivered together, a framework for the financial world.
Split Release into Features
With a lot to do and a strict timeline the product manager split the relase phase into three steps
Phase 1 (Core products):
- CRM
- Alerts
- Charts
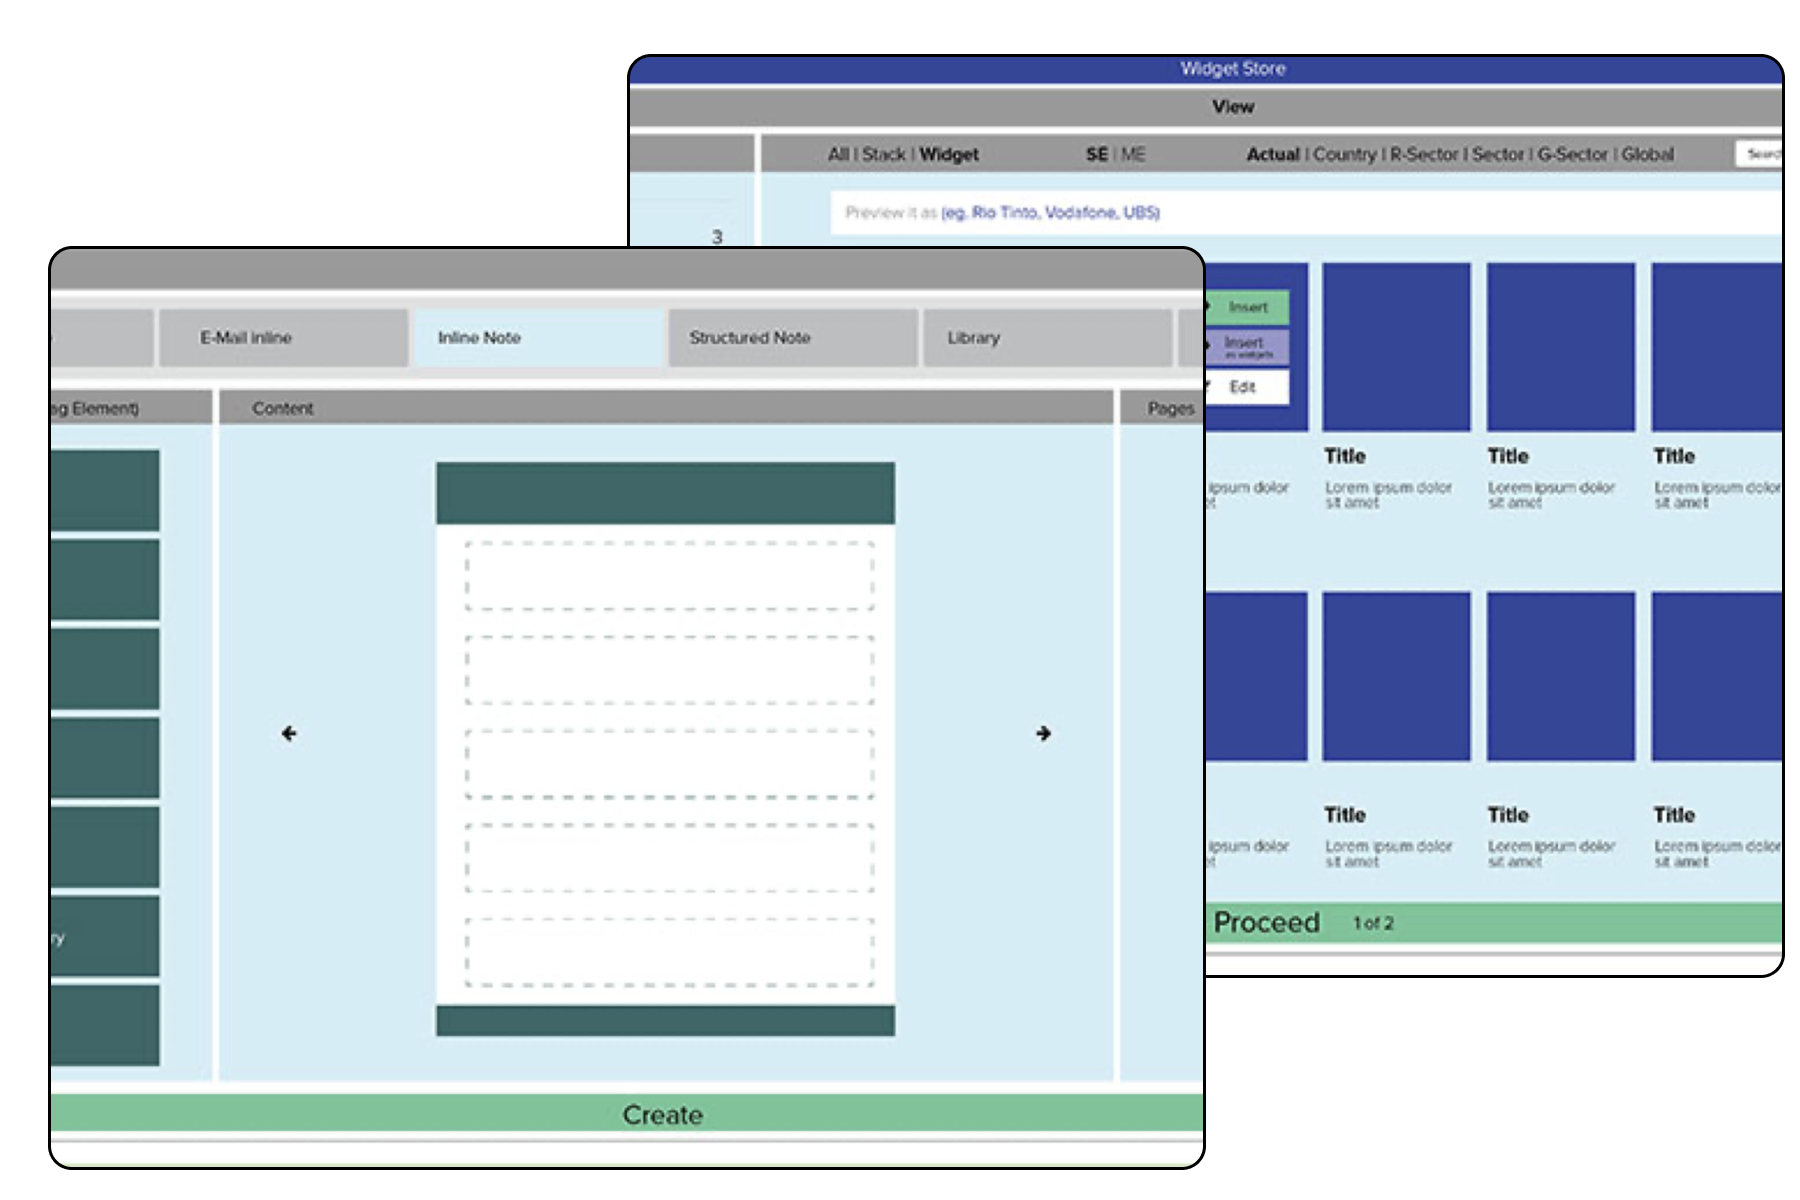
Phase 2 (Third party integration):
- Calendar
- Messaging
- Note Builder
- Widget Library
Phase 3 (Desk leader specific):
- Screening
- Dashboard
- Technicals
Each product has been structured to work as a stand alone product as well as integrated with s.m.ar.t. suite when bounded together. I had to develop Information Architecture and prototype functionalities for each one, basically working on 10 different sub-projects, each one with its own complexities and different user flows.
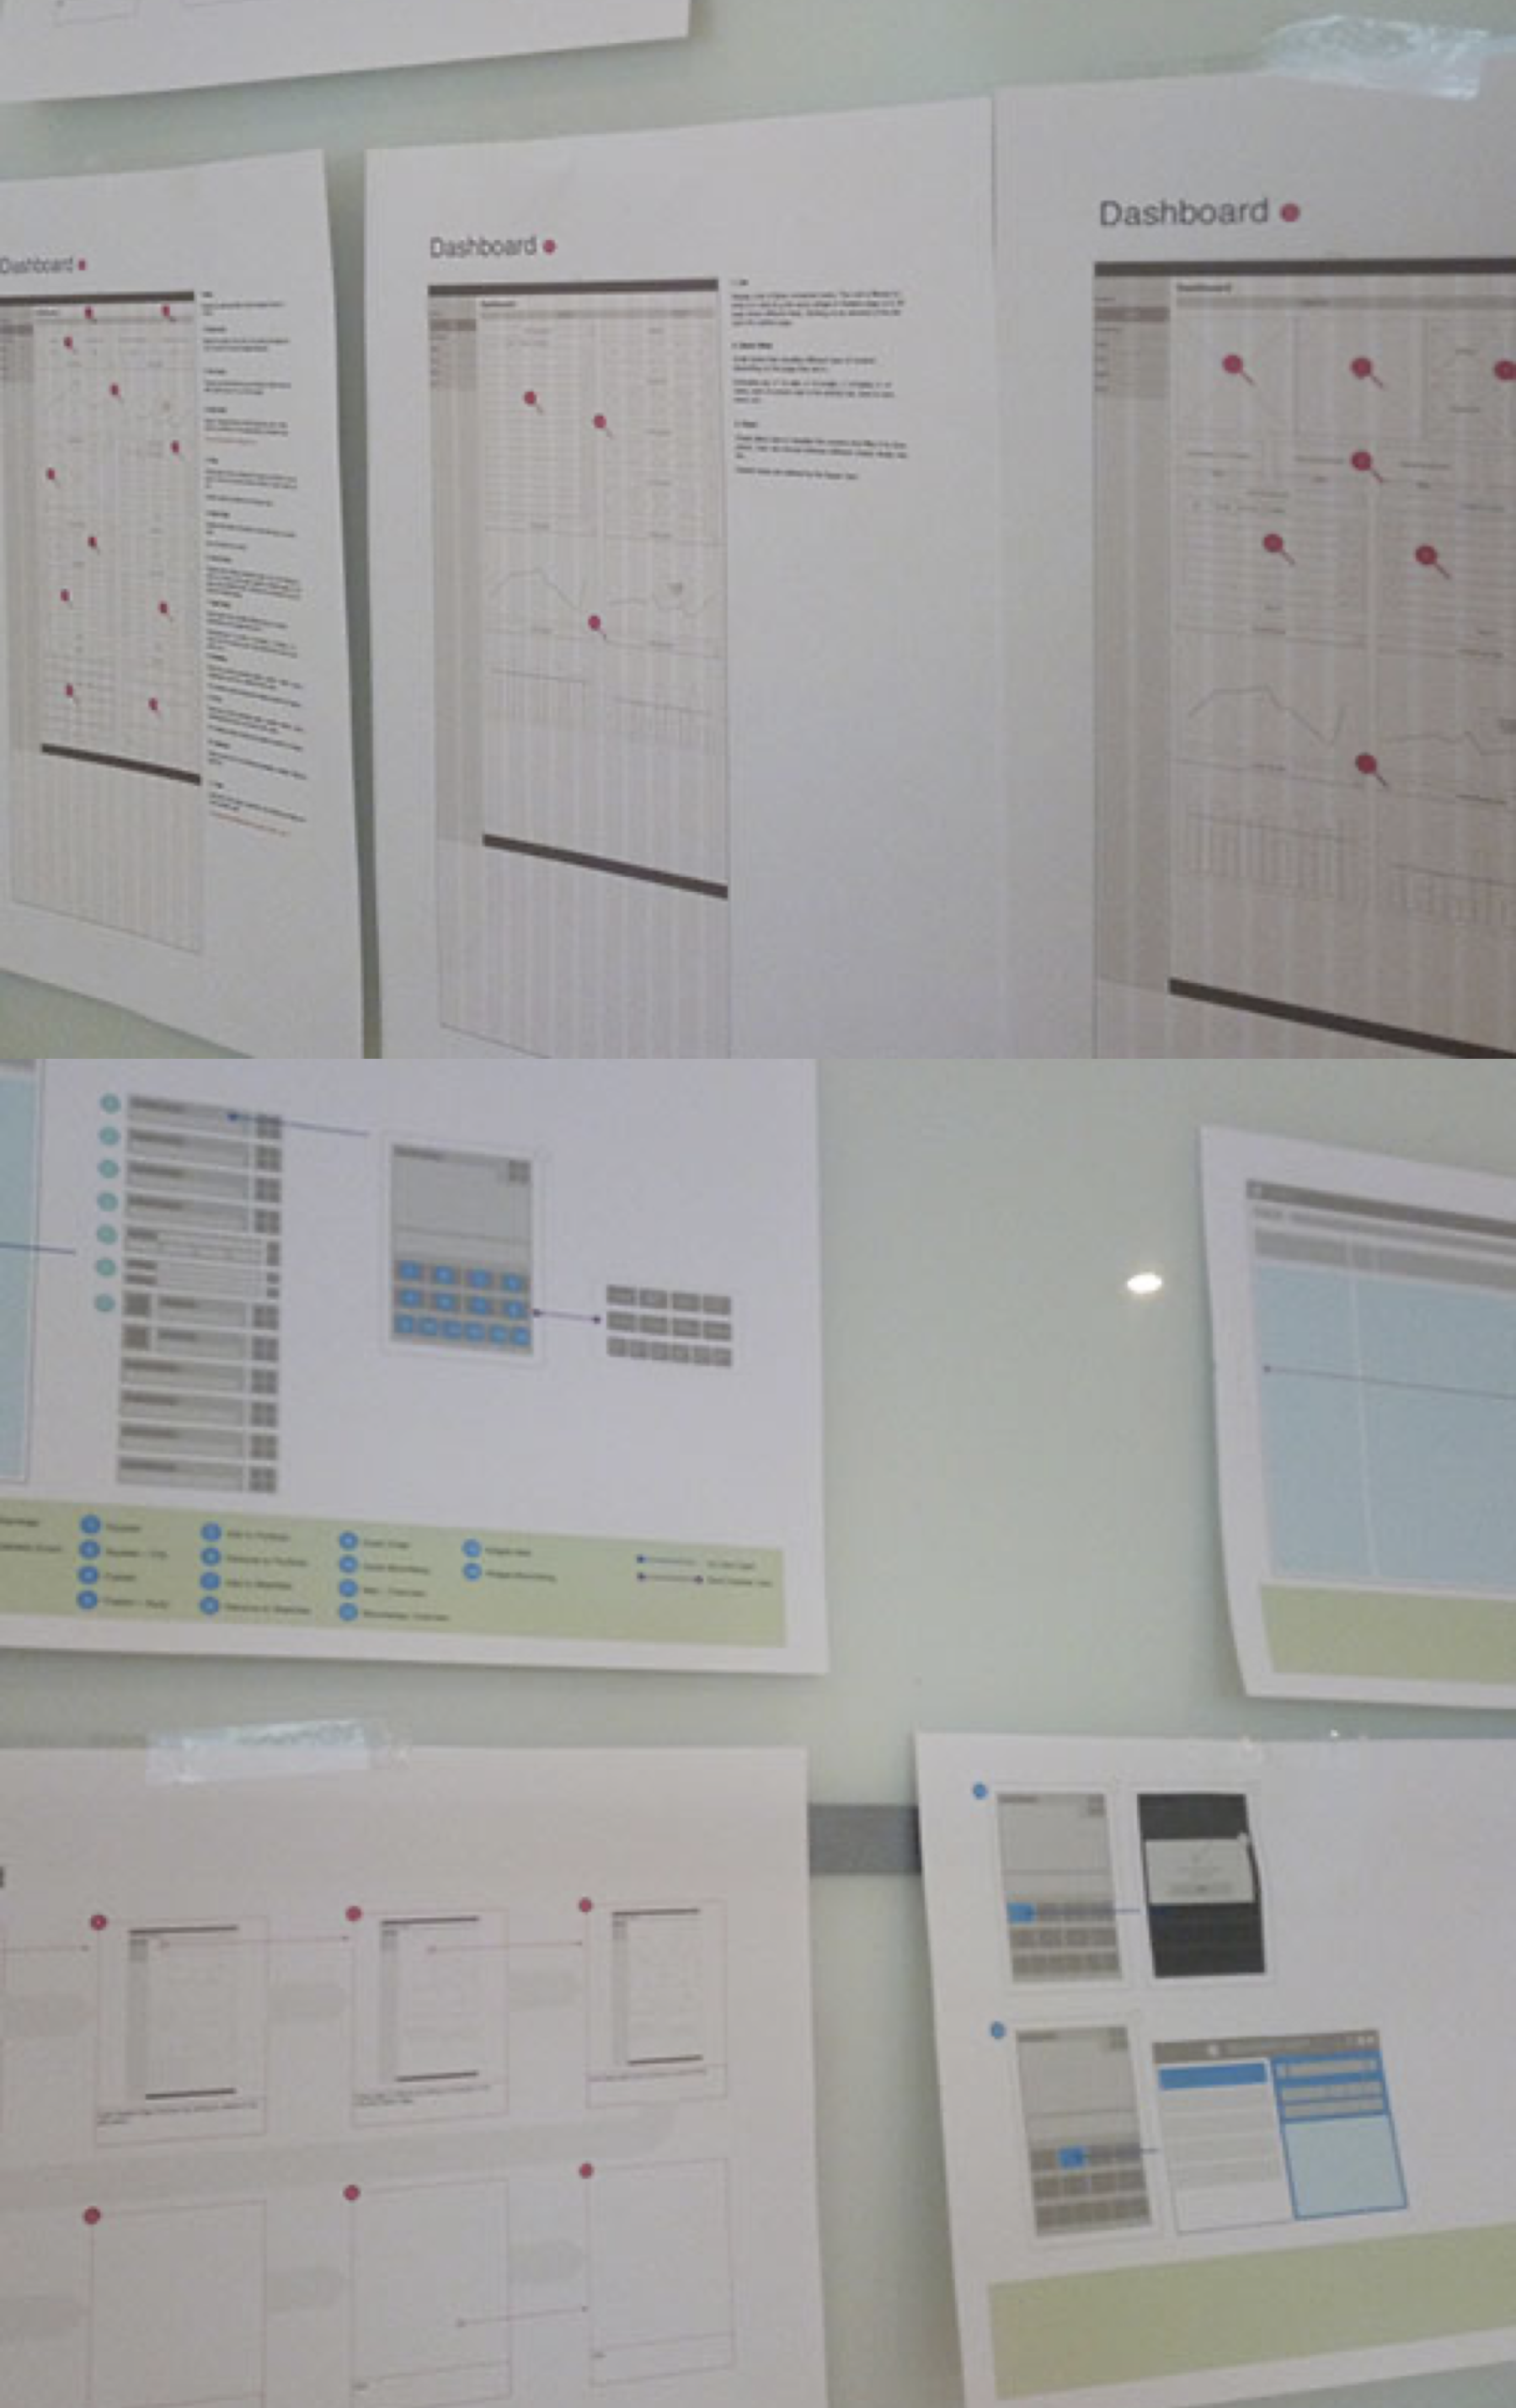
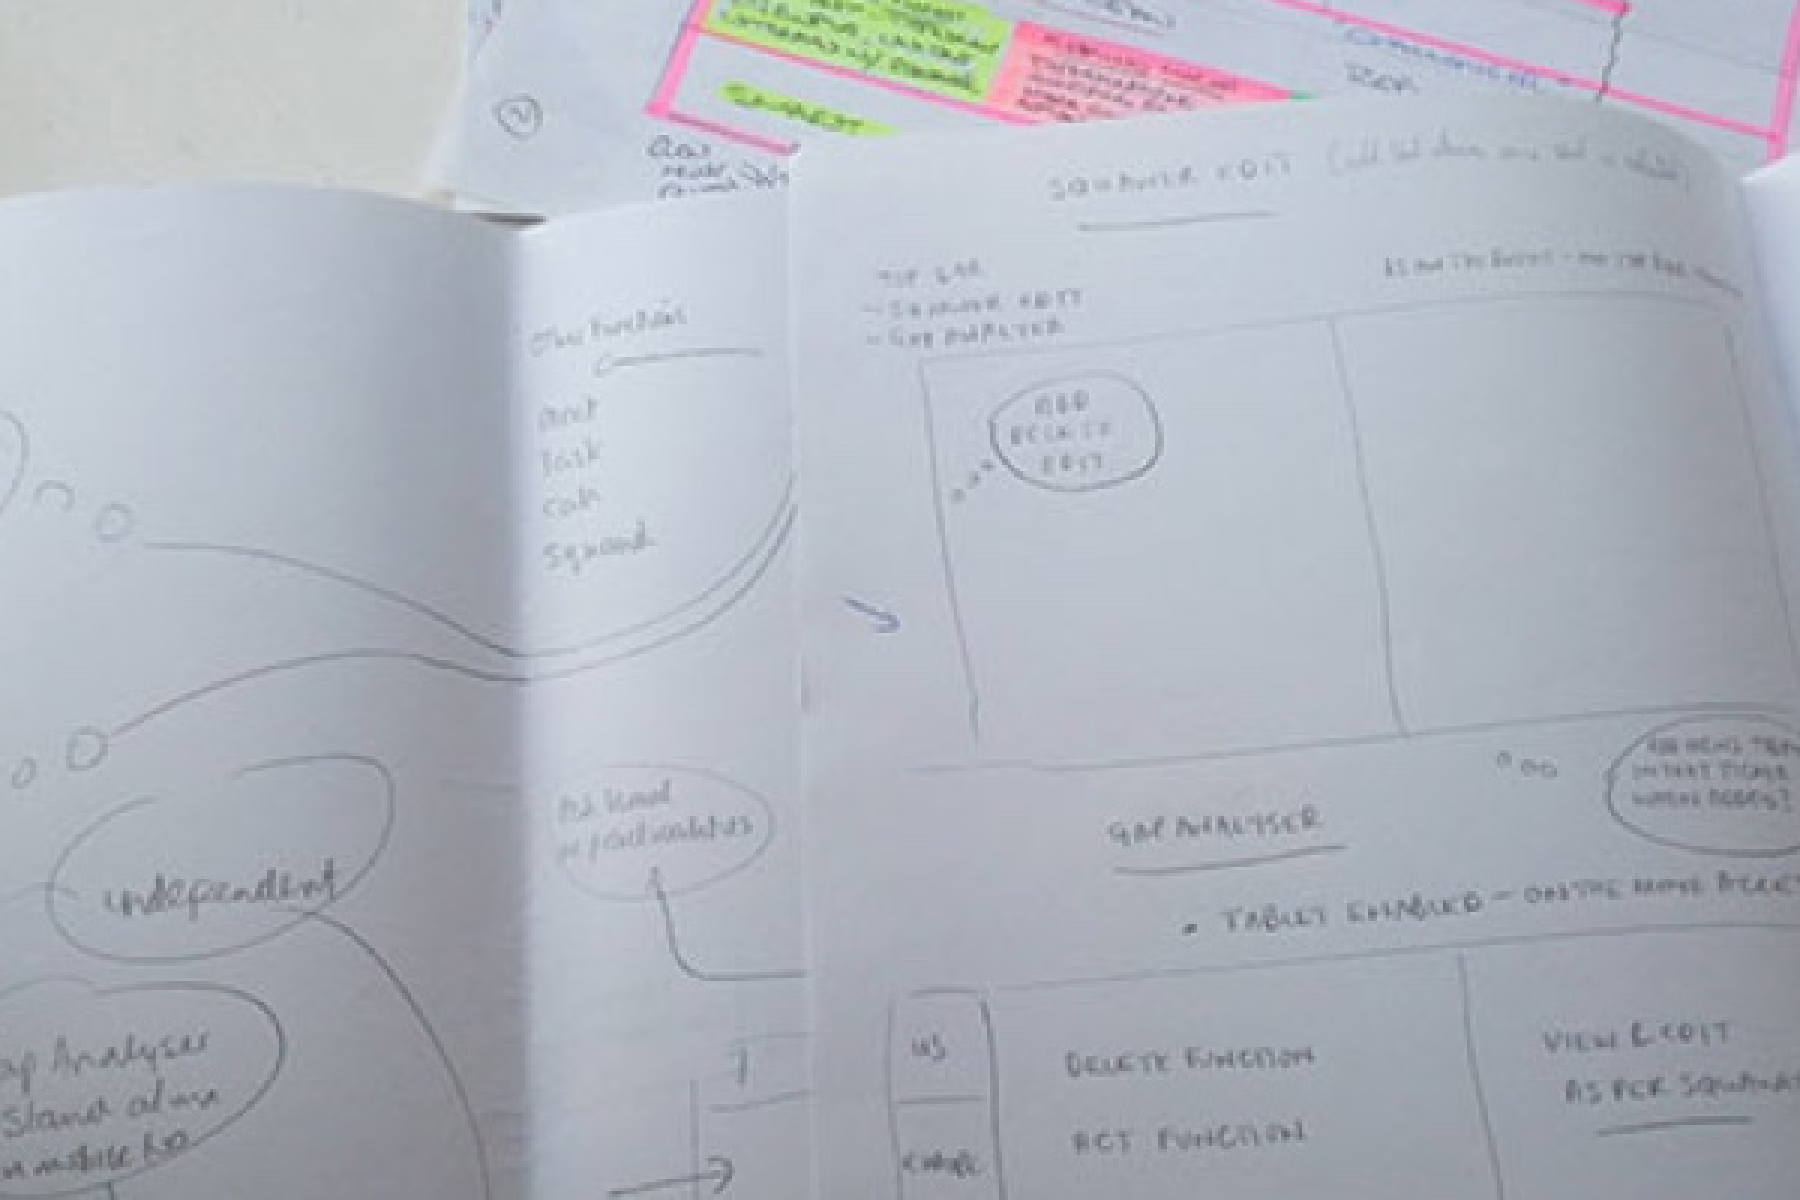
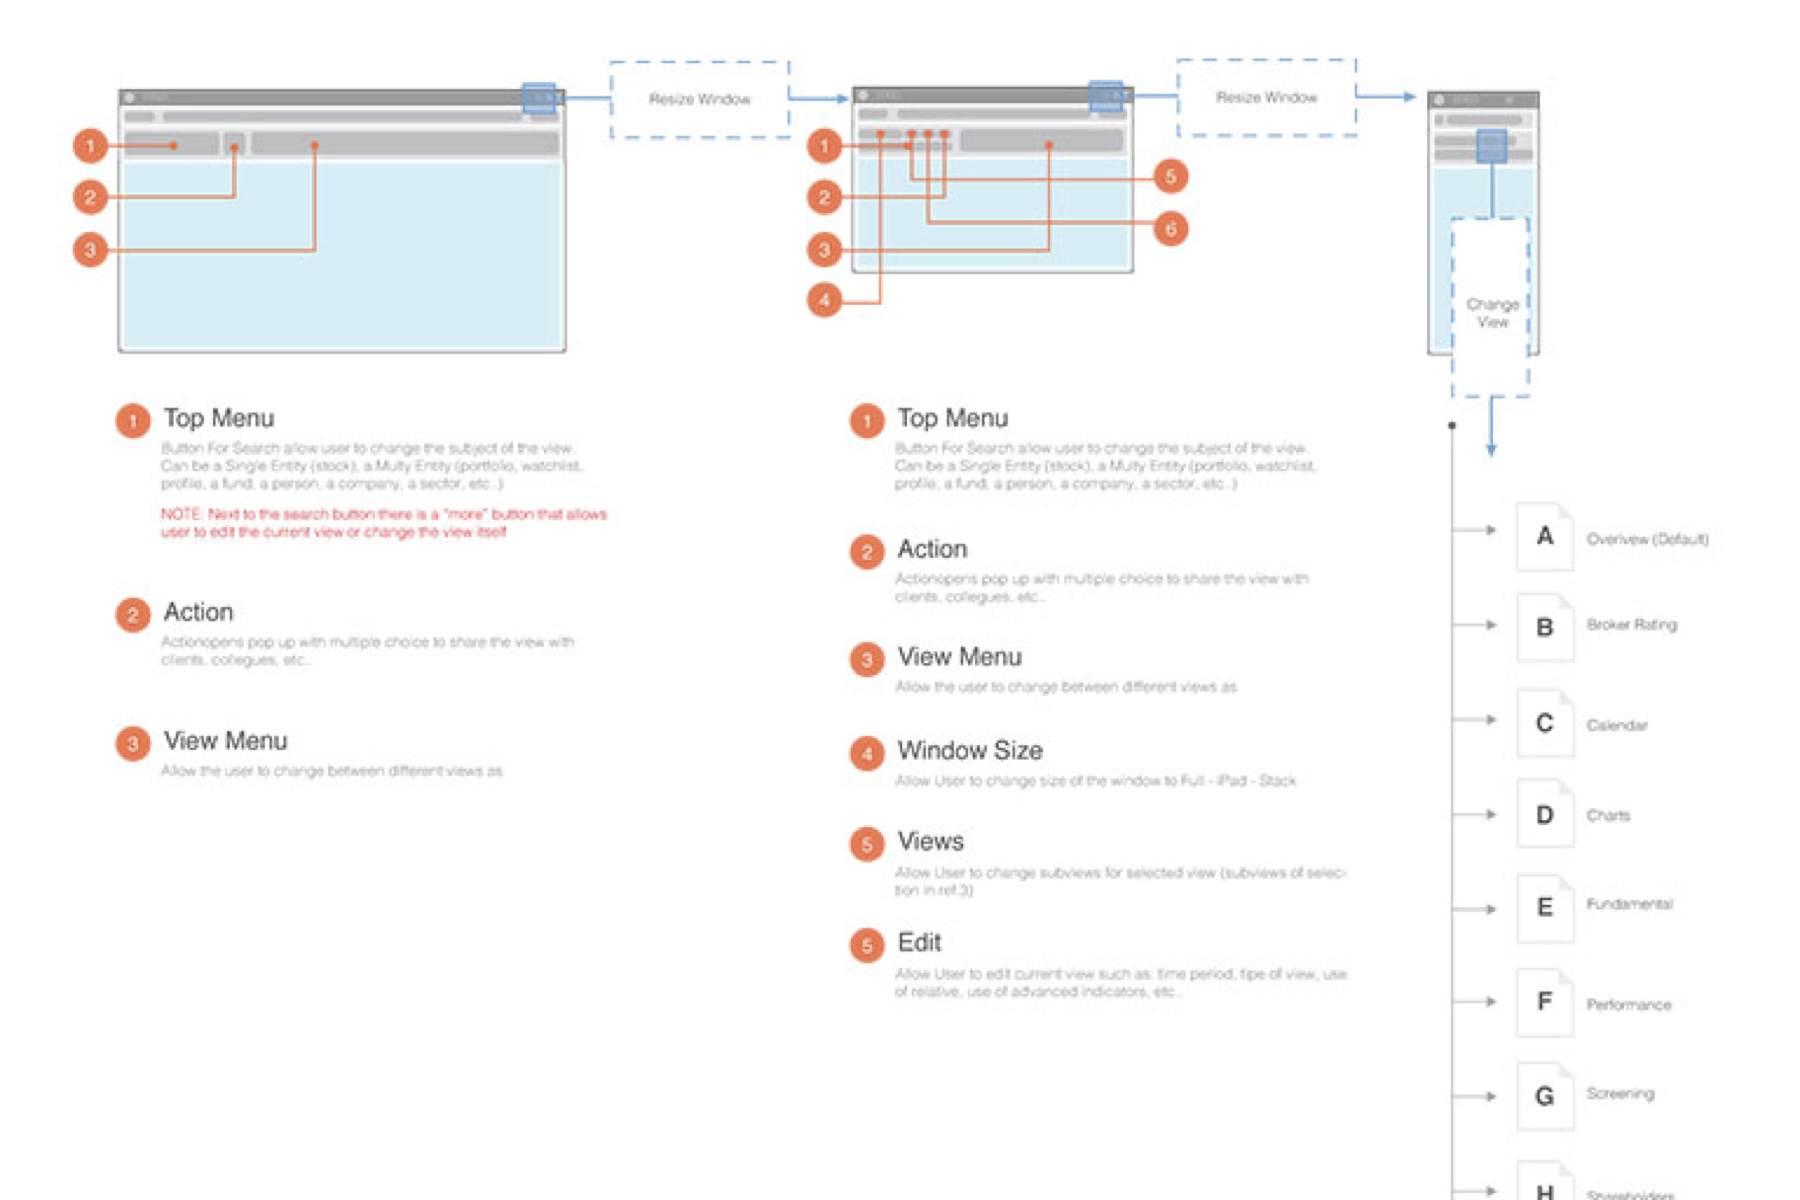
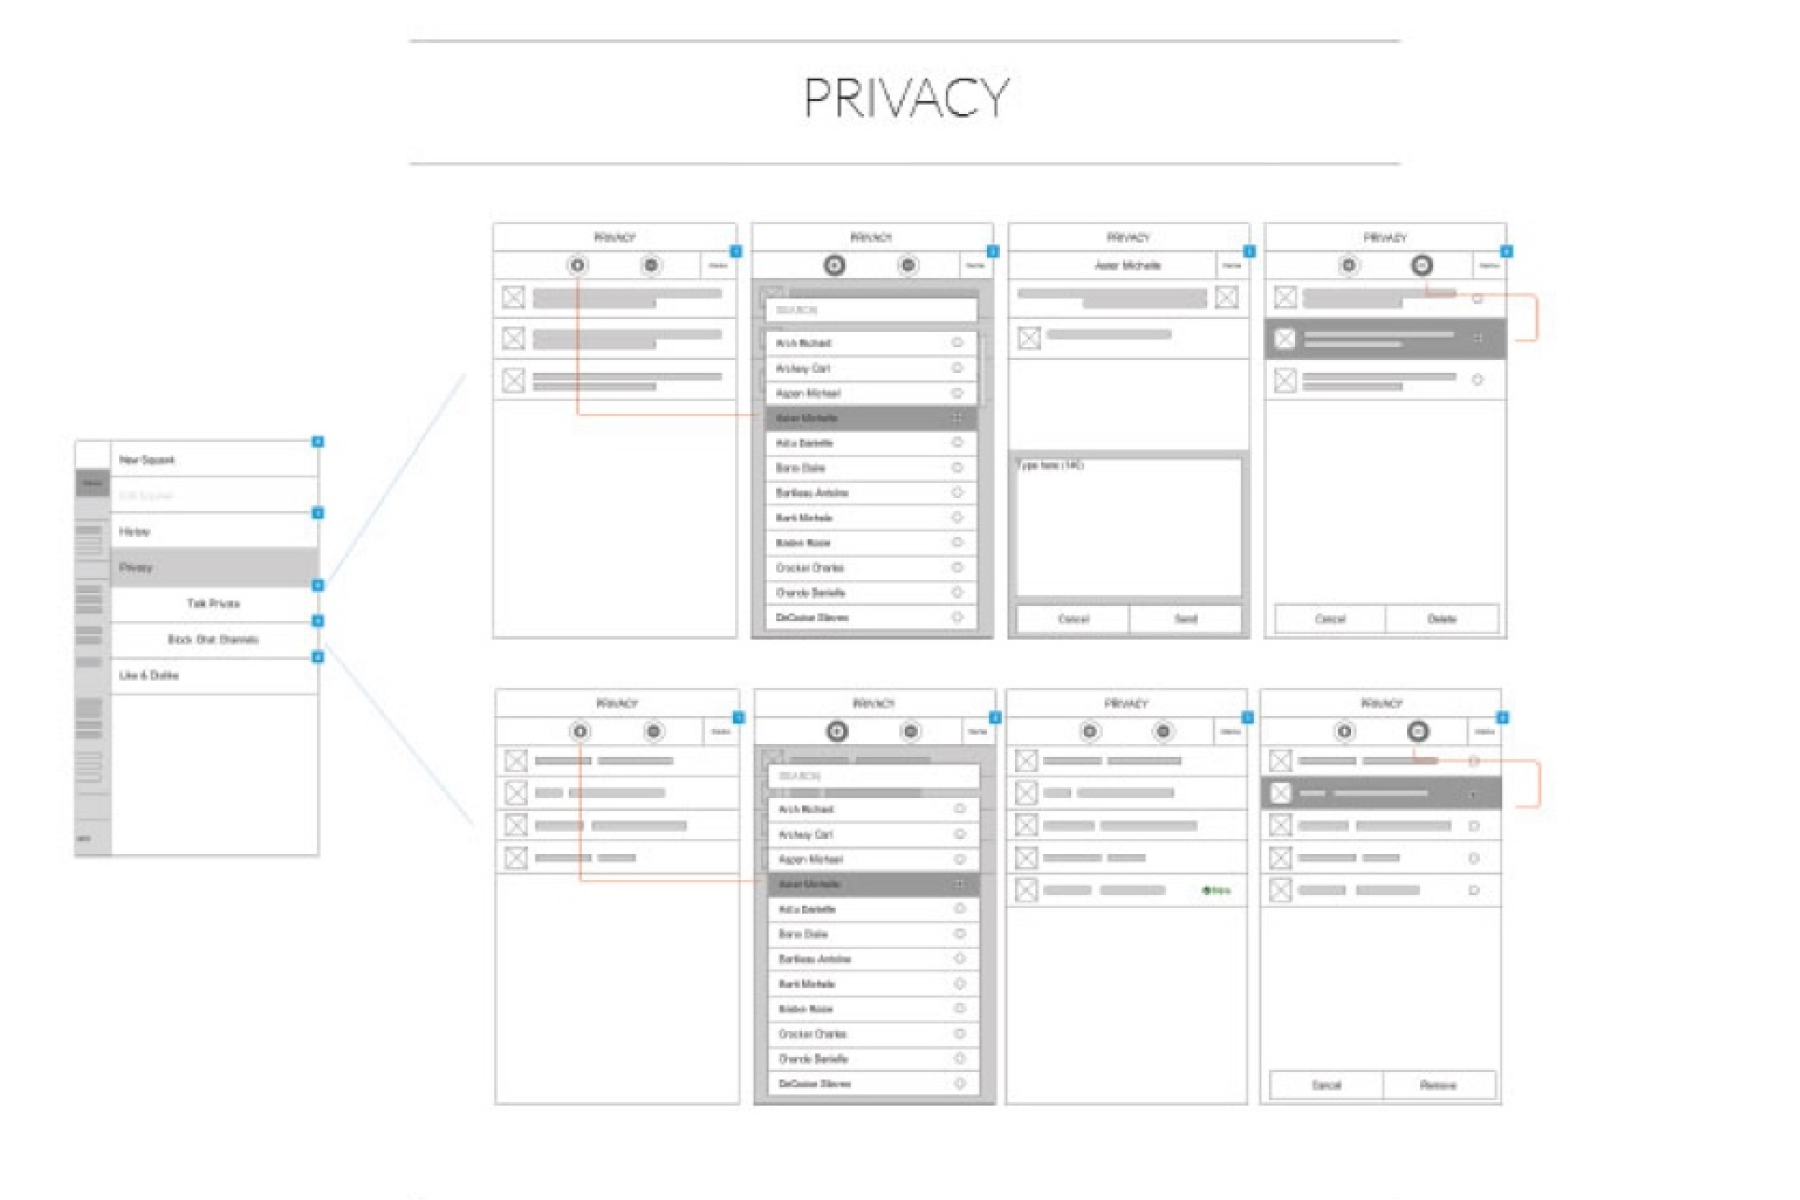
Wireframes
To help demonstrate some of the UI solutions suggested as next step from the UX audit conducted, I put together several focused greybox and wireframe deliverables to supplement the audit's findings and recommendations.
With the architecture set, I set out to design the layout and information of key pages to these flows, keeping in mind the flexibility needed for both the variety of products sold and the need of a responsive framework.
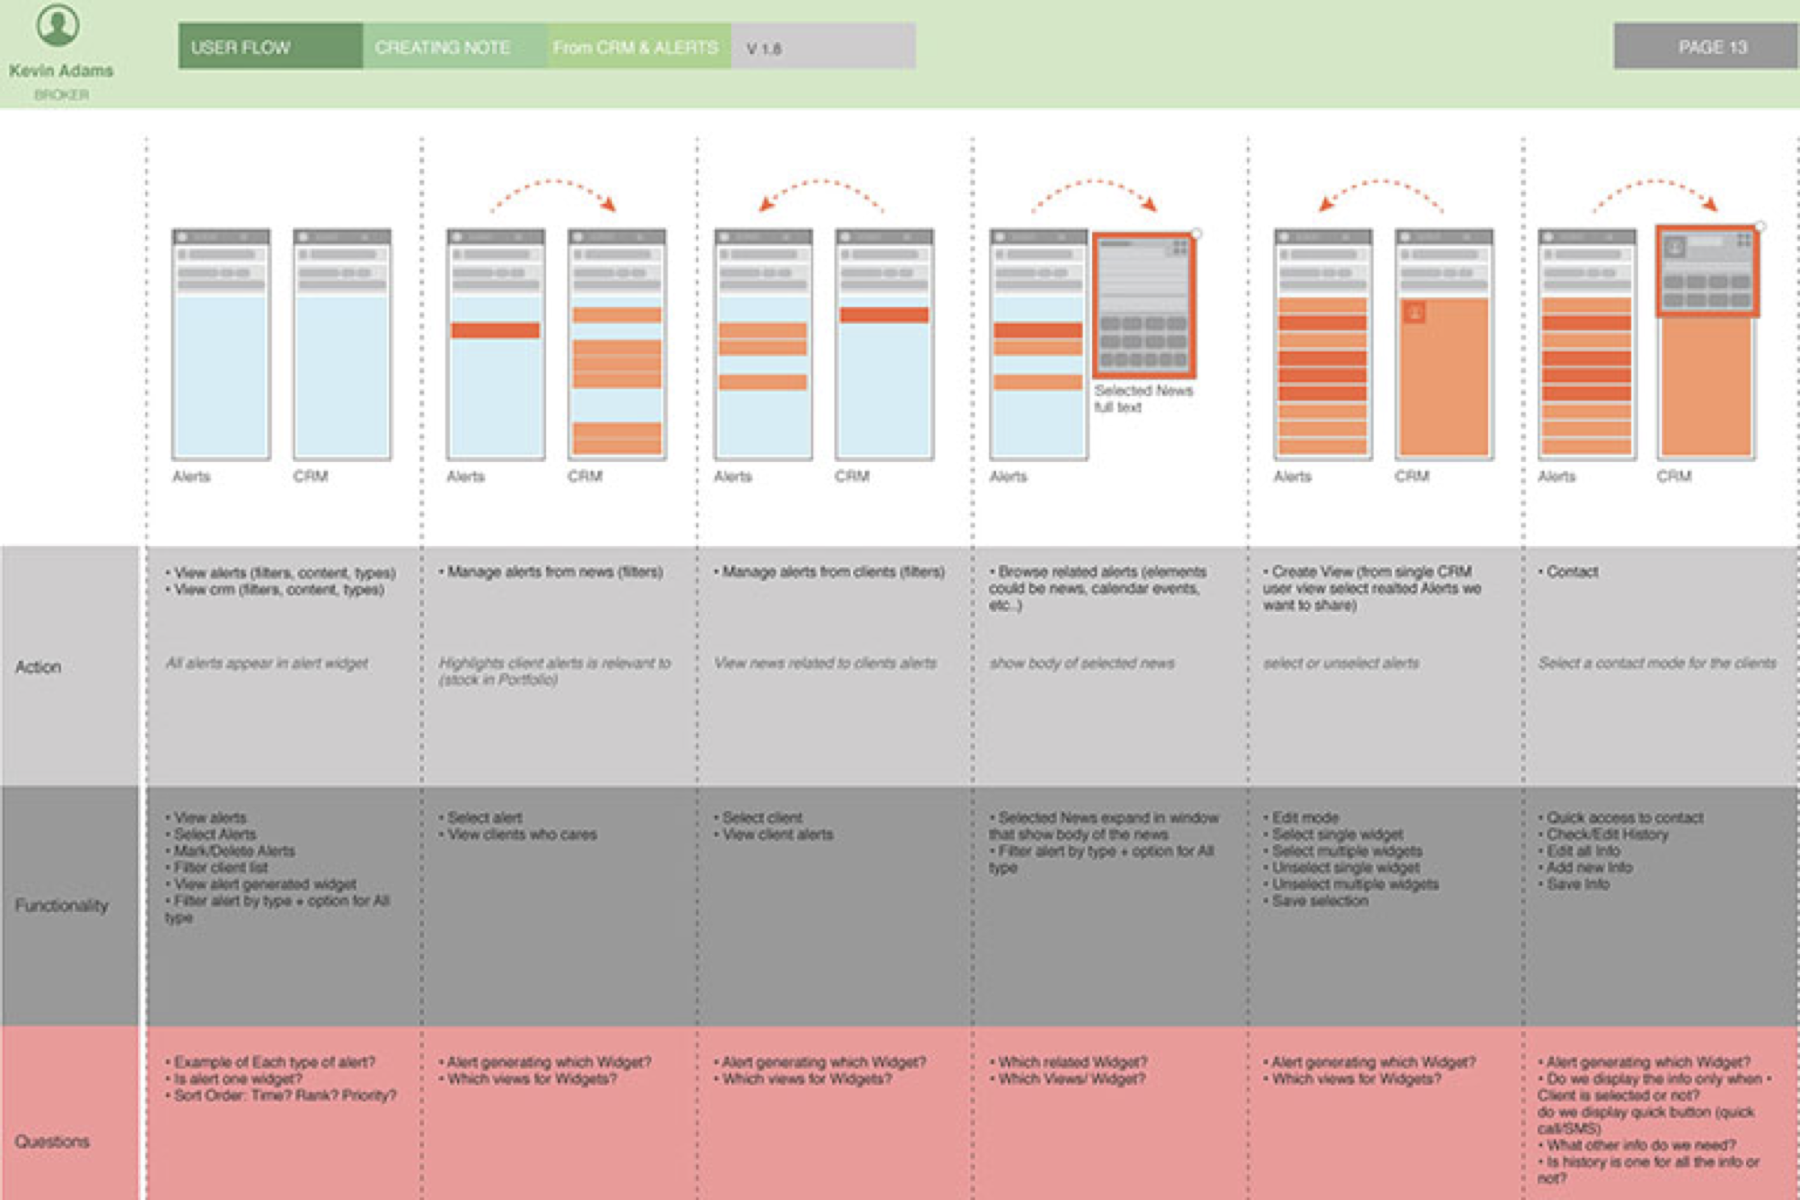
Iteration
I started to produce wireframe and iterate them on a weekly basis, working 2-3 days per products, testing solutions with client, team and developers.
With the architecture set, I set out to design the layout and information of key pages to these flows, keeping in mind the flexibility needed for both the variety of products sold and the need of a responsive framework.
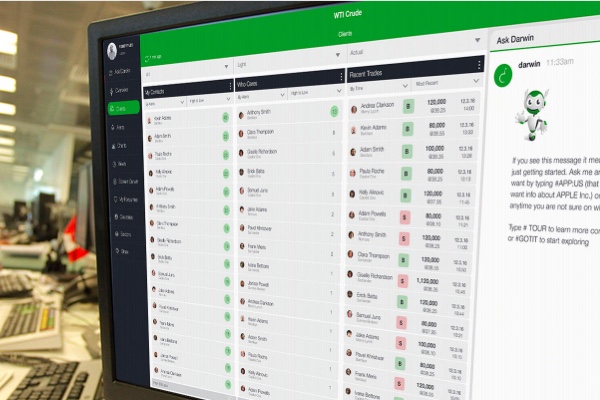
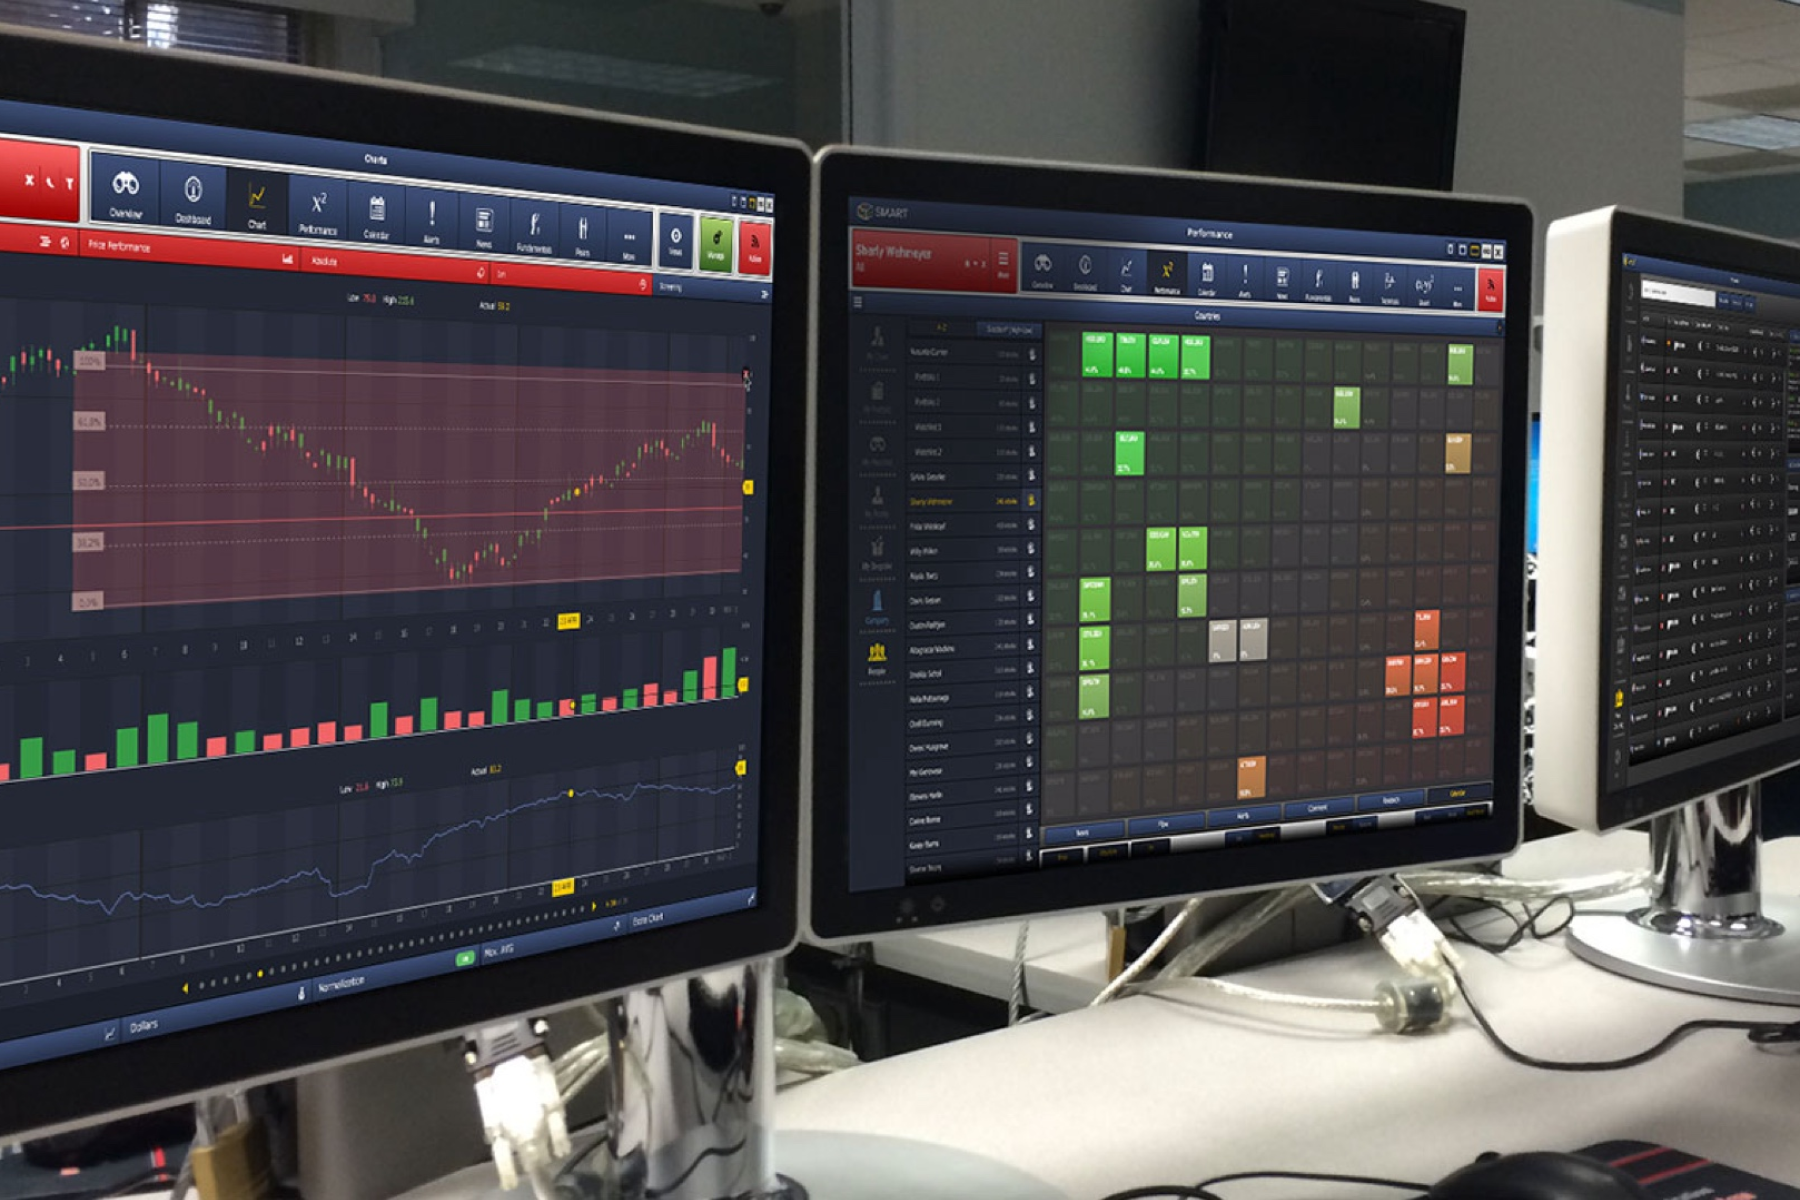
MVP
After the first 8 months SMART Phase 1 was ready to be tested with the Equity desk and I jumped into the production of the UI and documentation for the development team.
Because of the scale of the project, I initially created 2 style guides and I prototype the key components of the system using both, to allow test and decisions. We select the best one with the client according to the current status quo in the financial system and on some quick test on readability and satisfaction of the user.
The MVP's development was an intensive phase of design exploration and refinement where we prioritized core functionalities that our tests and prototypes had validated, focusing on an intuitive conversational interface that anticipates and responds to user needs.
Lean UX and Iterations
After getting feedbacks from the first early adopters I test a few users on functionalities and on our main areas on intervention, evaluating the KPI we set at the beginnign of the project against this new product (Easyest of contacting a client and talk of his/her portfolio/watchlist, easyeast of managing portfolios/watchlist, time spent in creating a report, etc..).
From this point on, I had both developed new products for the next planned phases as long as iterating the products we already developed with the clients and the team.
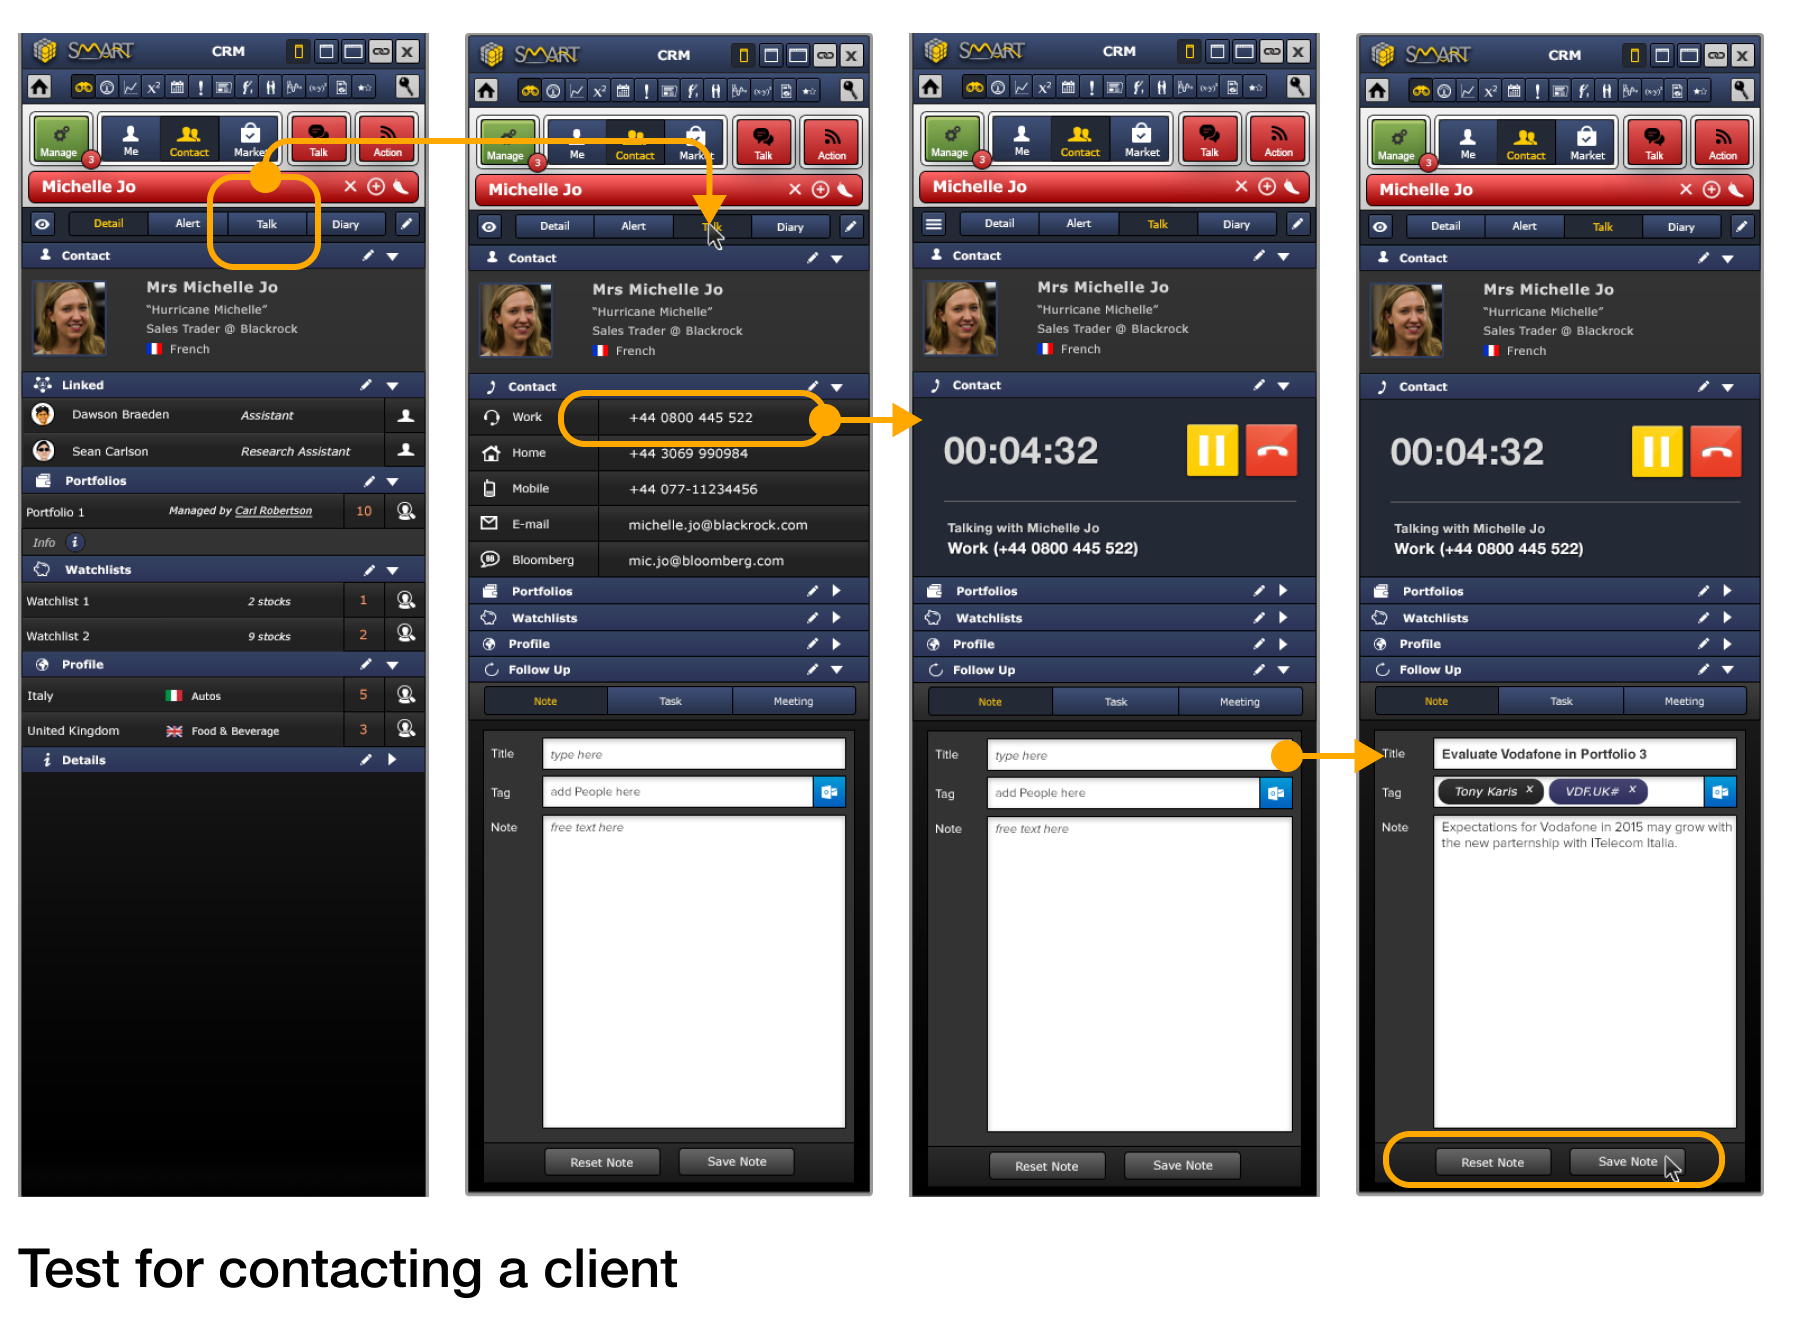
Bloomberg vs SMART
To evaluate satisfaction of the current version we tested 8 users asked to use Bloomberg and then SMART to accomplish specific tasks like visualise my clients, visualise a single entity chart, a multi entity chart, add a stock to a portfolio, edit a portfolio, see related news to a specific stock, see overview of a stock, create a note and send it to client, see last client contacted by the team.
After this tasks we asked the users to fulfill a survey aimed to evaluate perceived engagement with the system (satisfaction, NPS and perceived ease of use).
Research
Using relatively small numbers of partecipants (8-11) for ethnographic research is more than sufficient; I should have organised from the beginning the documentation in separate folders based on the different stakeholders (management was focused on data and profitable actions) while peers preferred visualisation to get info.
Iteration
Working in realatively small team and with limited timeframe for each iteration has helped me develop a new way of organising files and discover new products to control and manage file versions; I also learned new techniques of prototyping and sketching (using low fidelity digital assets) to create disposable prototypes for quick iteration and analysis of functionalities.
Design
Without a doubt one of the most difficult part has been creating and manteining a unique an coherent UI across all the 6 different product we developed. Has been a process which has required a lot of iterations, tests and feedback from the team and the users to get to a point where all the products were perceived as unique when used as standalone but at the same time as part of a bigger family when used together.