Beagle - Integrate SAS
AI in Trading
UX/UI Designer
2015
Product Team
About
I was the solo designer consultant in the development of Beagle, a B2B AI platform for financial services. Our task was to leverage the company's deal with SAS to integrate their powerful AI capabilities into existing financial workflows, harnessing untapped data and transforming it into a decision-support system.
Duration
4 Months
How I started
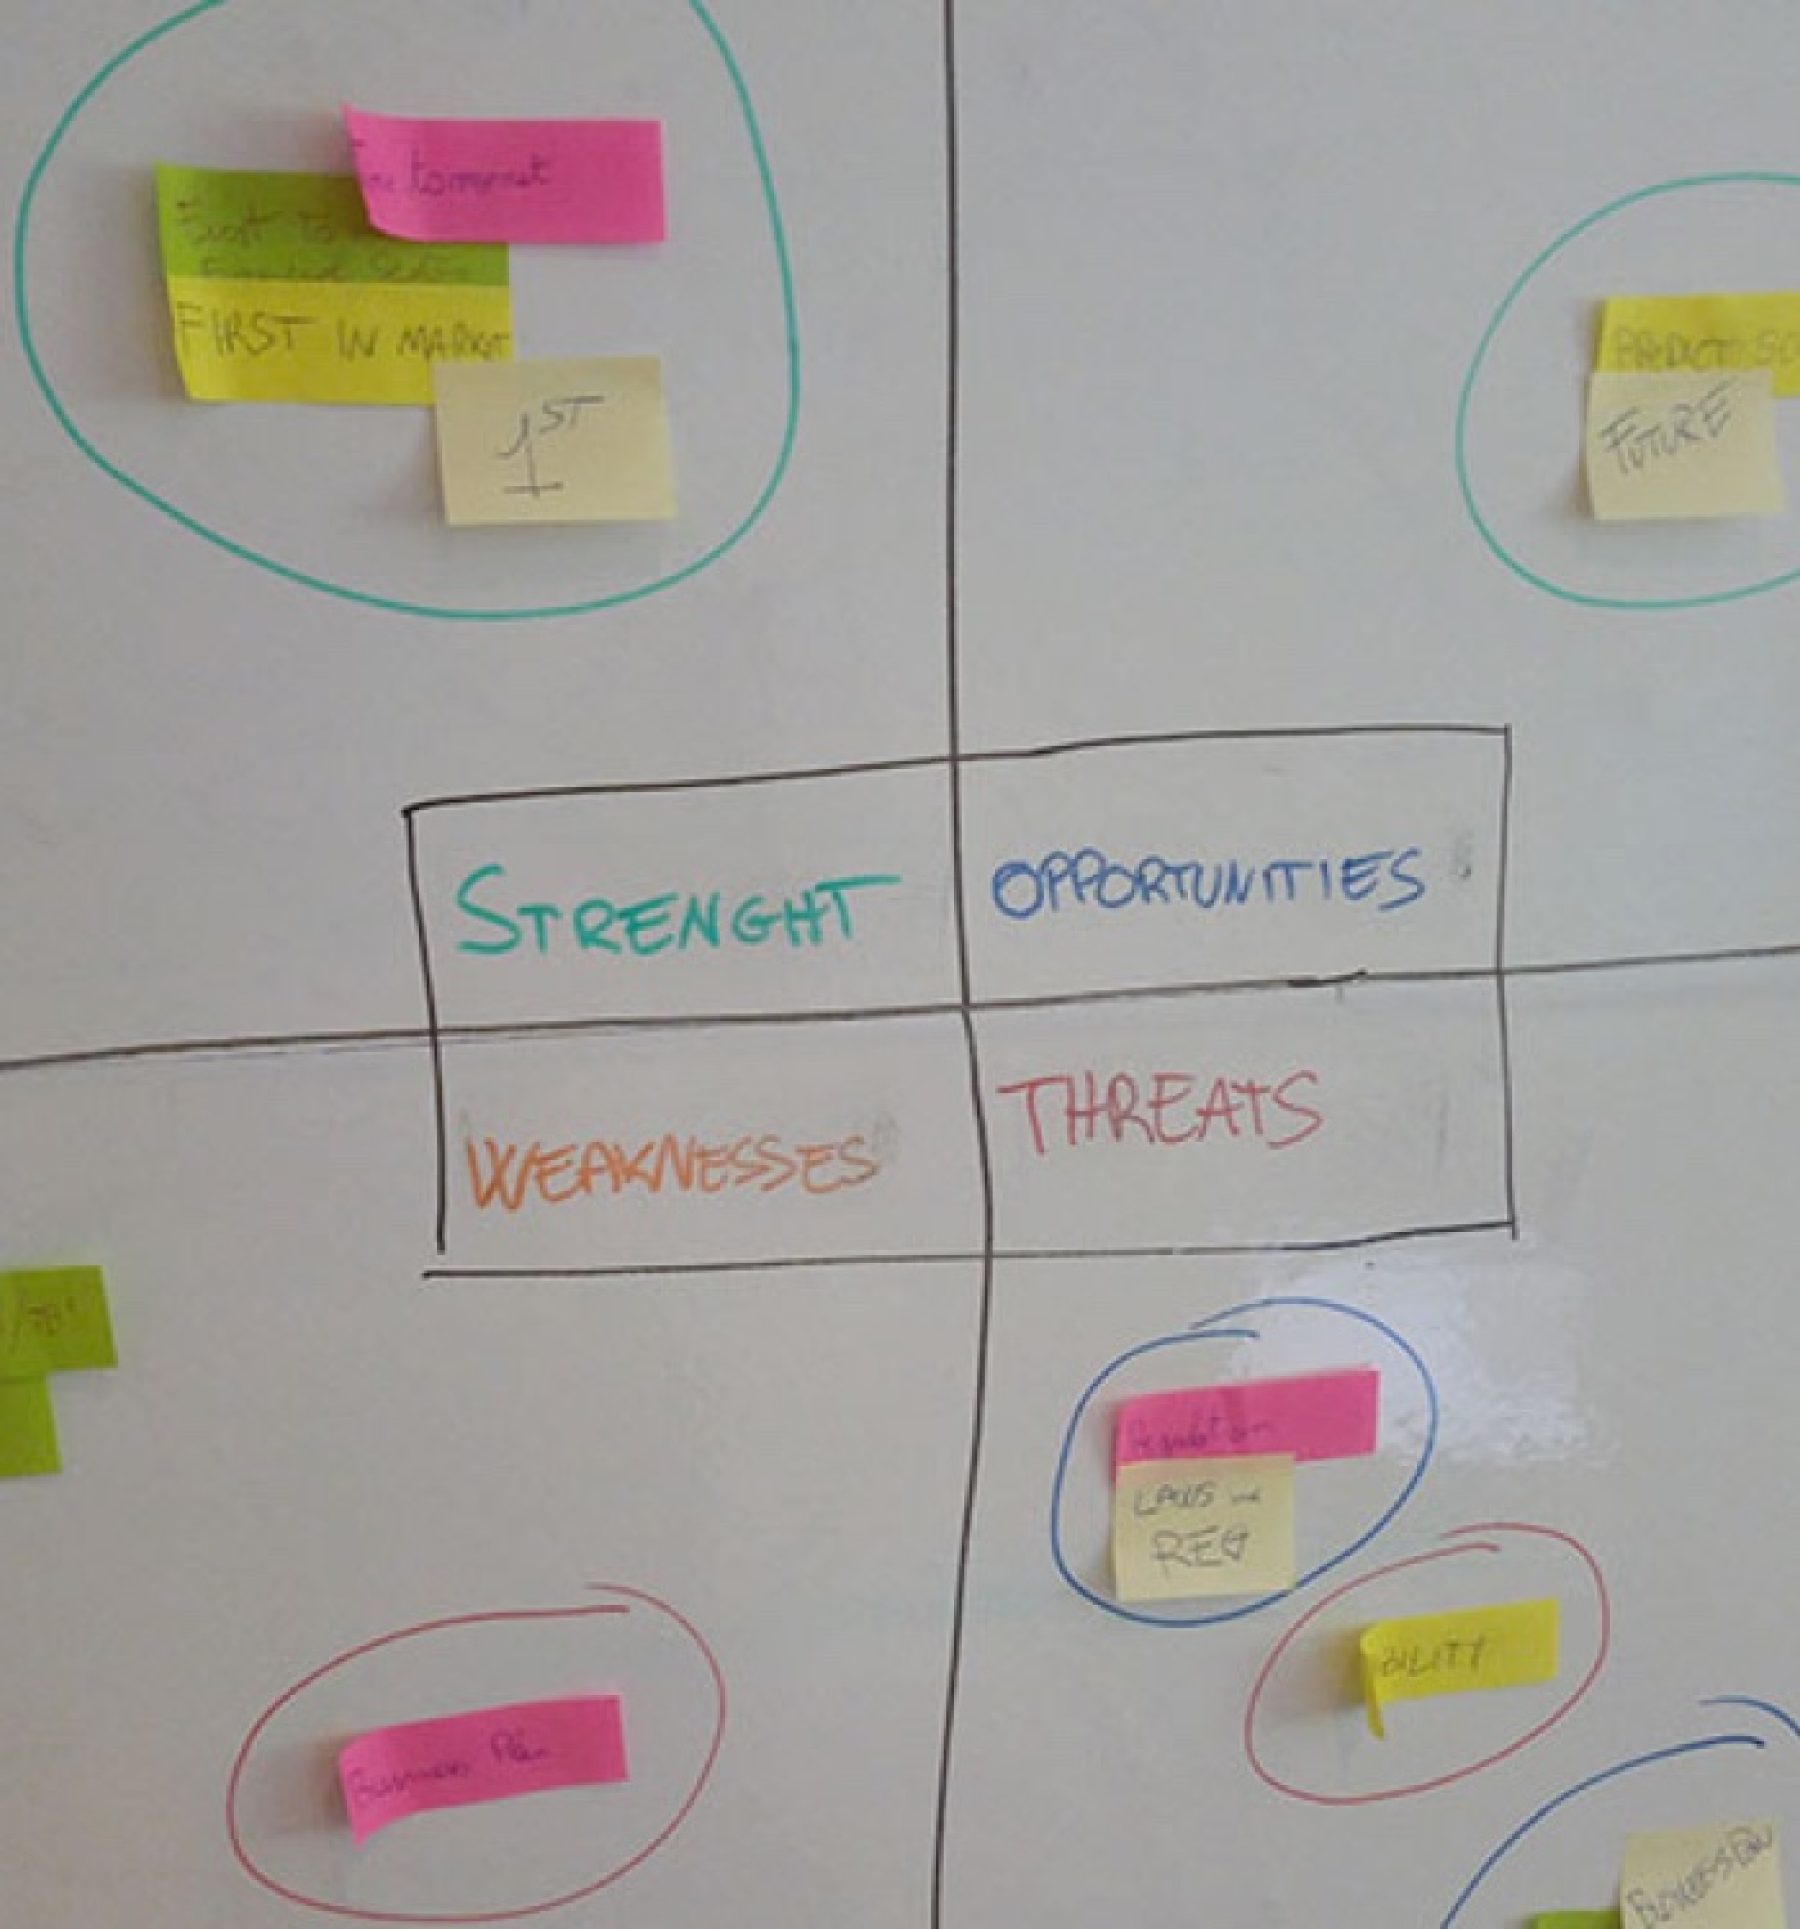
At the outset the Beagle project appeared very straightforward to me: integrate SAS AI power into their existing financial workflows to enhance decision-making. Yet, the absence of direct competitors similar features or benchmarks signaled a more intricate challenge ahead.

Initial Research
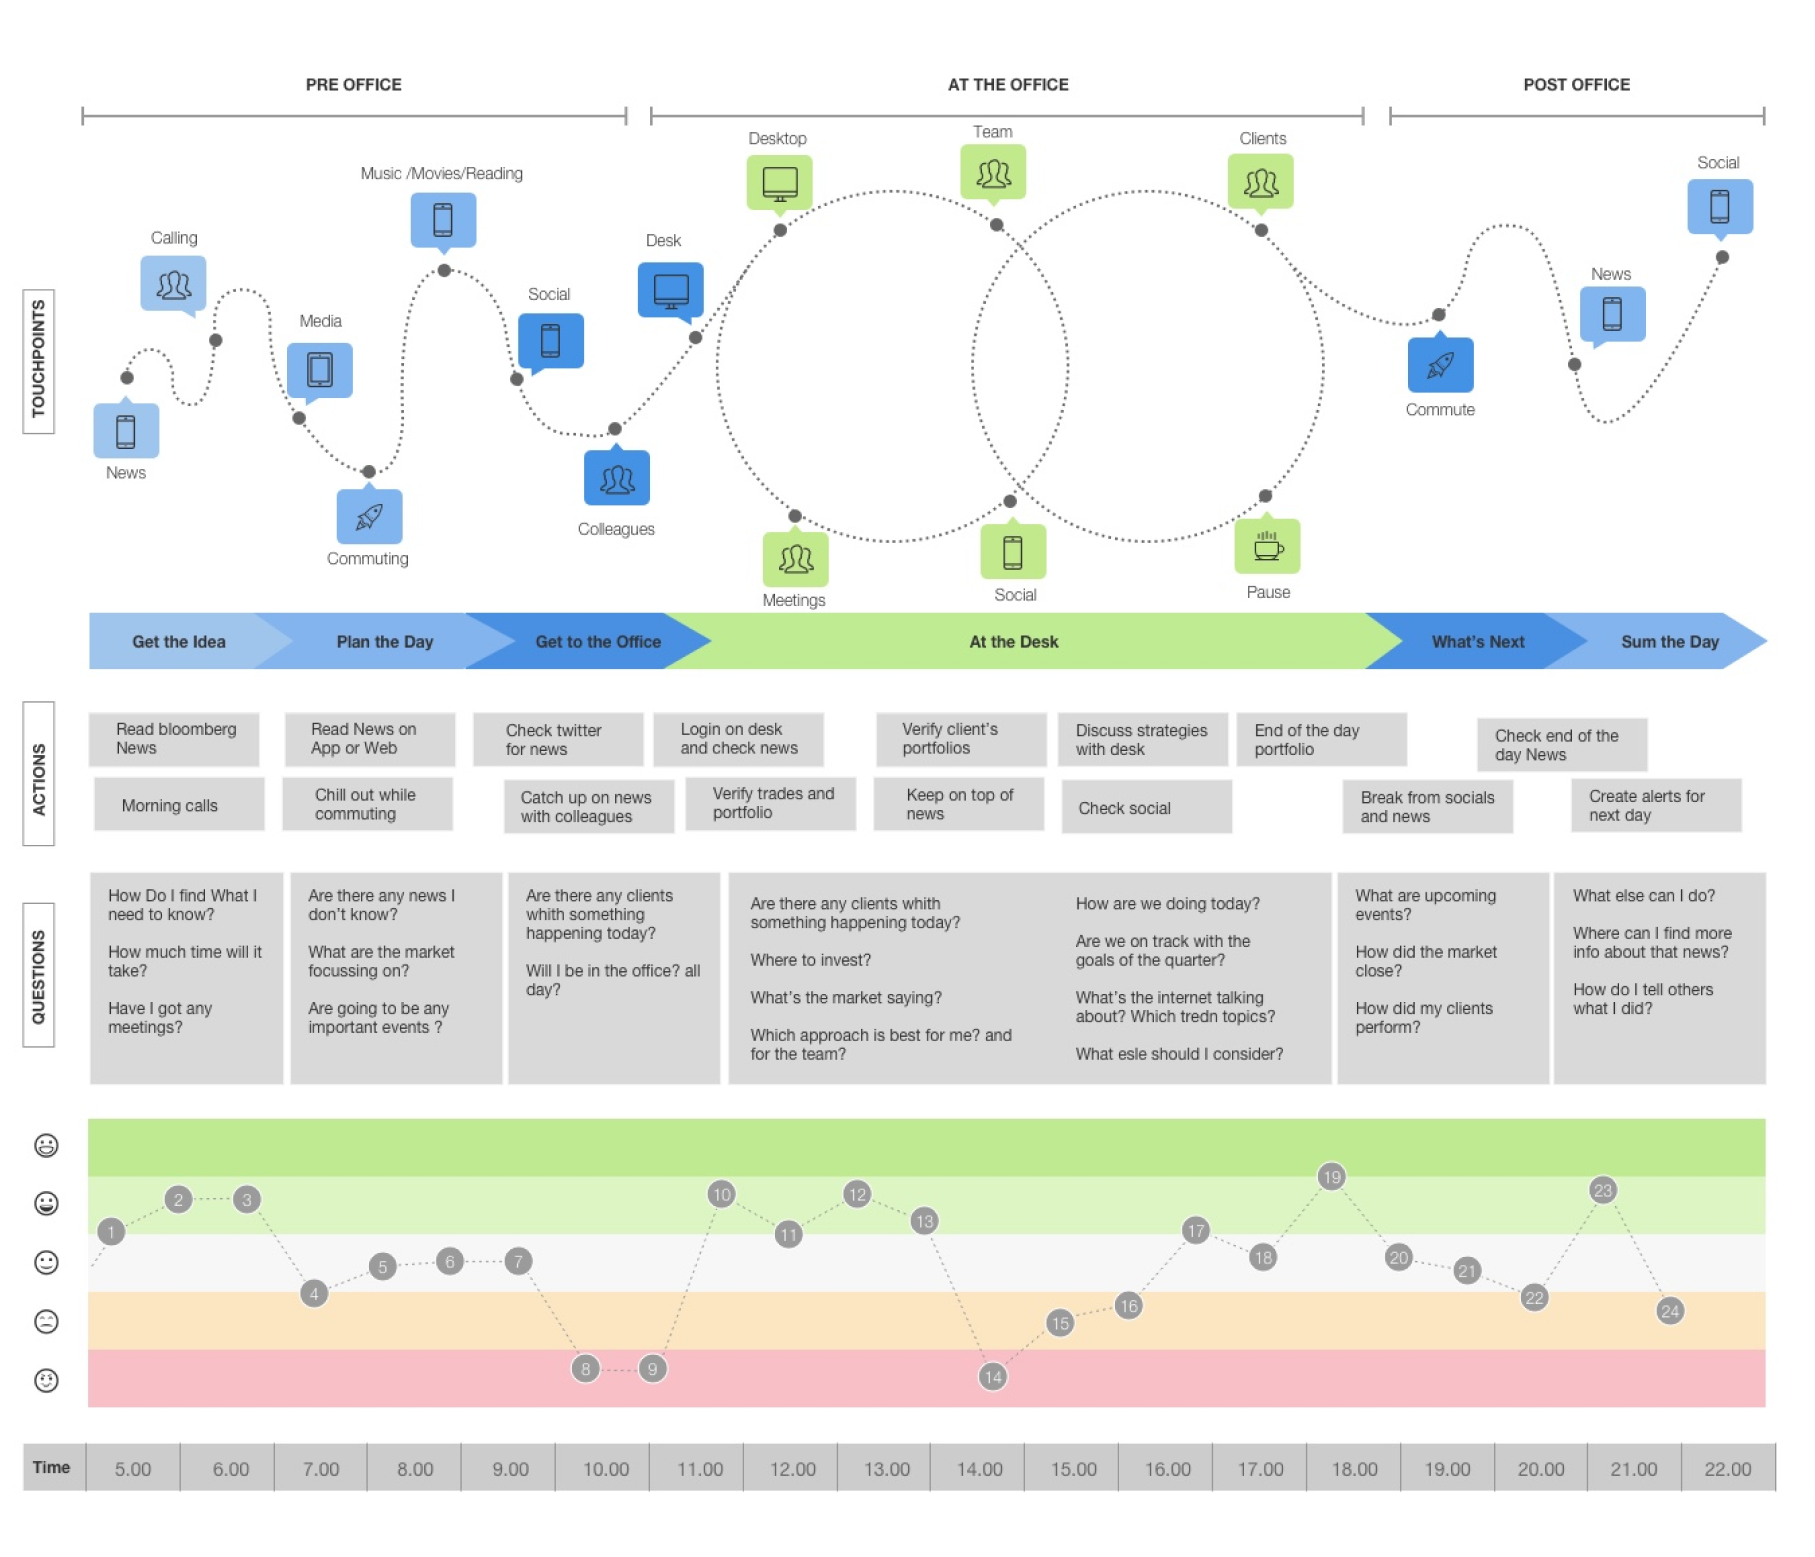
My initial step was deep diving into the daily tools and strategies of traders and brokers, having a seat on their desk-floor to watch how they operate and to interact when possible was a big help on this.
Without access to competitor data I partnered up with Product Manager and turned to primary research, conducting nine in-depth interviews that revealed a reliance on outdated, data-heavy methodologies.
"I don't think people understand that every decision we make has a huge impact on the company, our colleagues and our personal life" .. "At the end of the when I go home to my family I want to be as focused as I'm at work, but I often found myself reading updates on Twitter"
Initial Insights
These interviews were transformative, not just in gathering data but in how we processed it. Plotting these insights into an Excel file, a pattern emerged, segmenting users into specific behavioral groups. This led to the creation of detailed personas and empathy maps, focusing on the emotional journey of investment decisions.
It was here we found our breakthrough: the realization that financial decision-making was as emotional as it was analytical. This understanding pushed us to reimagine Beagle not merely as a data tool, but as a comprehensive decision-support system.
The emotional aspect of financial decision-making is often overlooked by the available tools which focus on quantitative data while neglecting the qualitative factors that can influence market movements.
Problem
Early in the design process users highlighted the need for a tool that could synthesize this mix of data into actionable insights, something our initial design did not fully accommodate so we faced the challenge of integrating qualitative insights, such as market sentiment and social media trends, with the quantitative data our platform already handled.
Solution
We flagged the "Social Sentiment Score" feature as priority, which would use SAS AI powered models to analyze vast amounts of unstructured data from news articles and social media, providing a sentiment score alongside other traditional metrics. Iterative testing and refinement helped us ensure this feature offered meaningful, actionable insights without overwhelming users with data.
Adapting Our approach
The insight gained from speaking with users like Alex, who valued a mix of quantitative and qualitative data, was pivotal. It compelled us to shift our strategy towards creating a more holistic platform.
This included developing features for sentiment analysis from news and social media, directly addressing the nuanced needs we had uncovered. Our approach became one of iterative exploration, balancing potential data integrations with real, articulated user needs.
For the Traders
Enabling them to make quicker, more informed decisions and also offering a balanced perspective that aids in managing the psychological pressures of the trading floor.
For the Client
Turning untapped data into strategic assets that enhance traders' performance: increasing transaction volumes and successful trades for single traders and teams alike.
For Growth
Position Beagle as a unique offering in the market by increasing customer retention and user satisfaction.
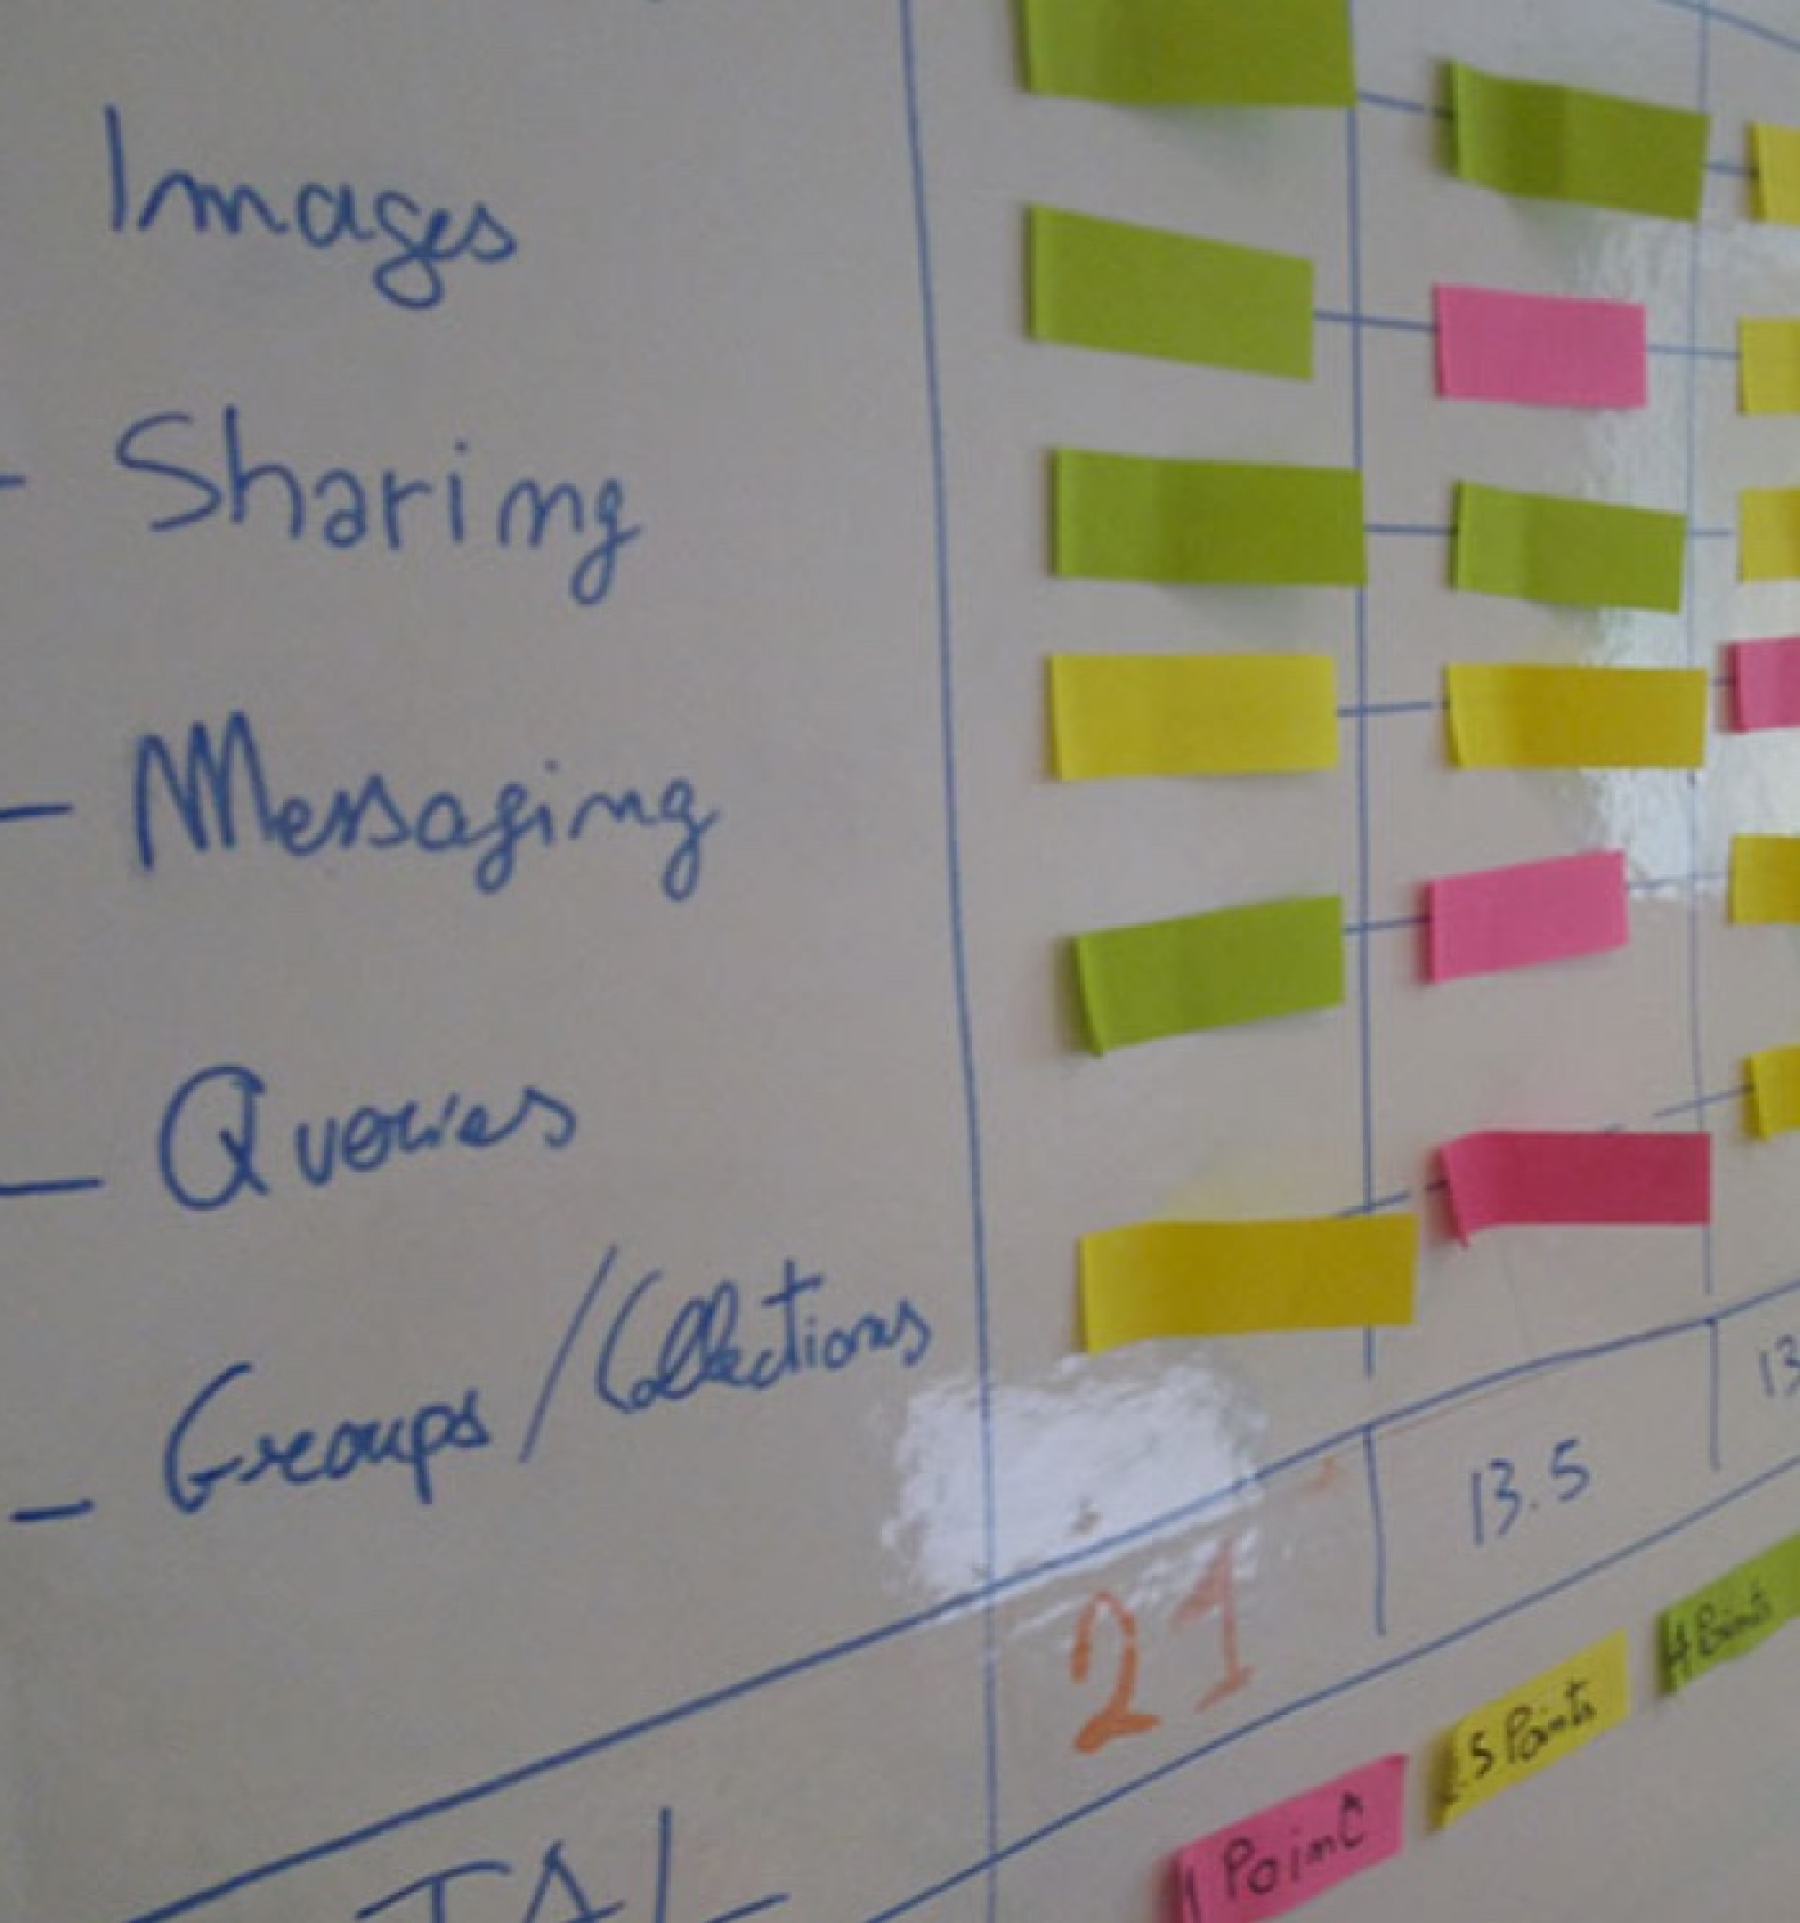
Prioritise informations
As a solo designer juggling multiple tasks the complexity of managing Beagle's expansive feature set was daunting. I partnered up with the Product Manager and a couple of Stakeholders to prioritising features, making it an exercise in strategic thinking and user-centric design by ensuring that each addition genuinely addressed user needs.
Early-stage interviews and task analysis revealed key user tasks and pain points, leading to a gap analysis that identified critical areas for our AI to address. This process was pretty agile and saw us revisiting and refining our designs based on continuous user feedback and competitive analysis.
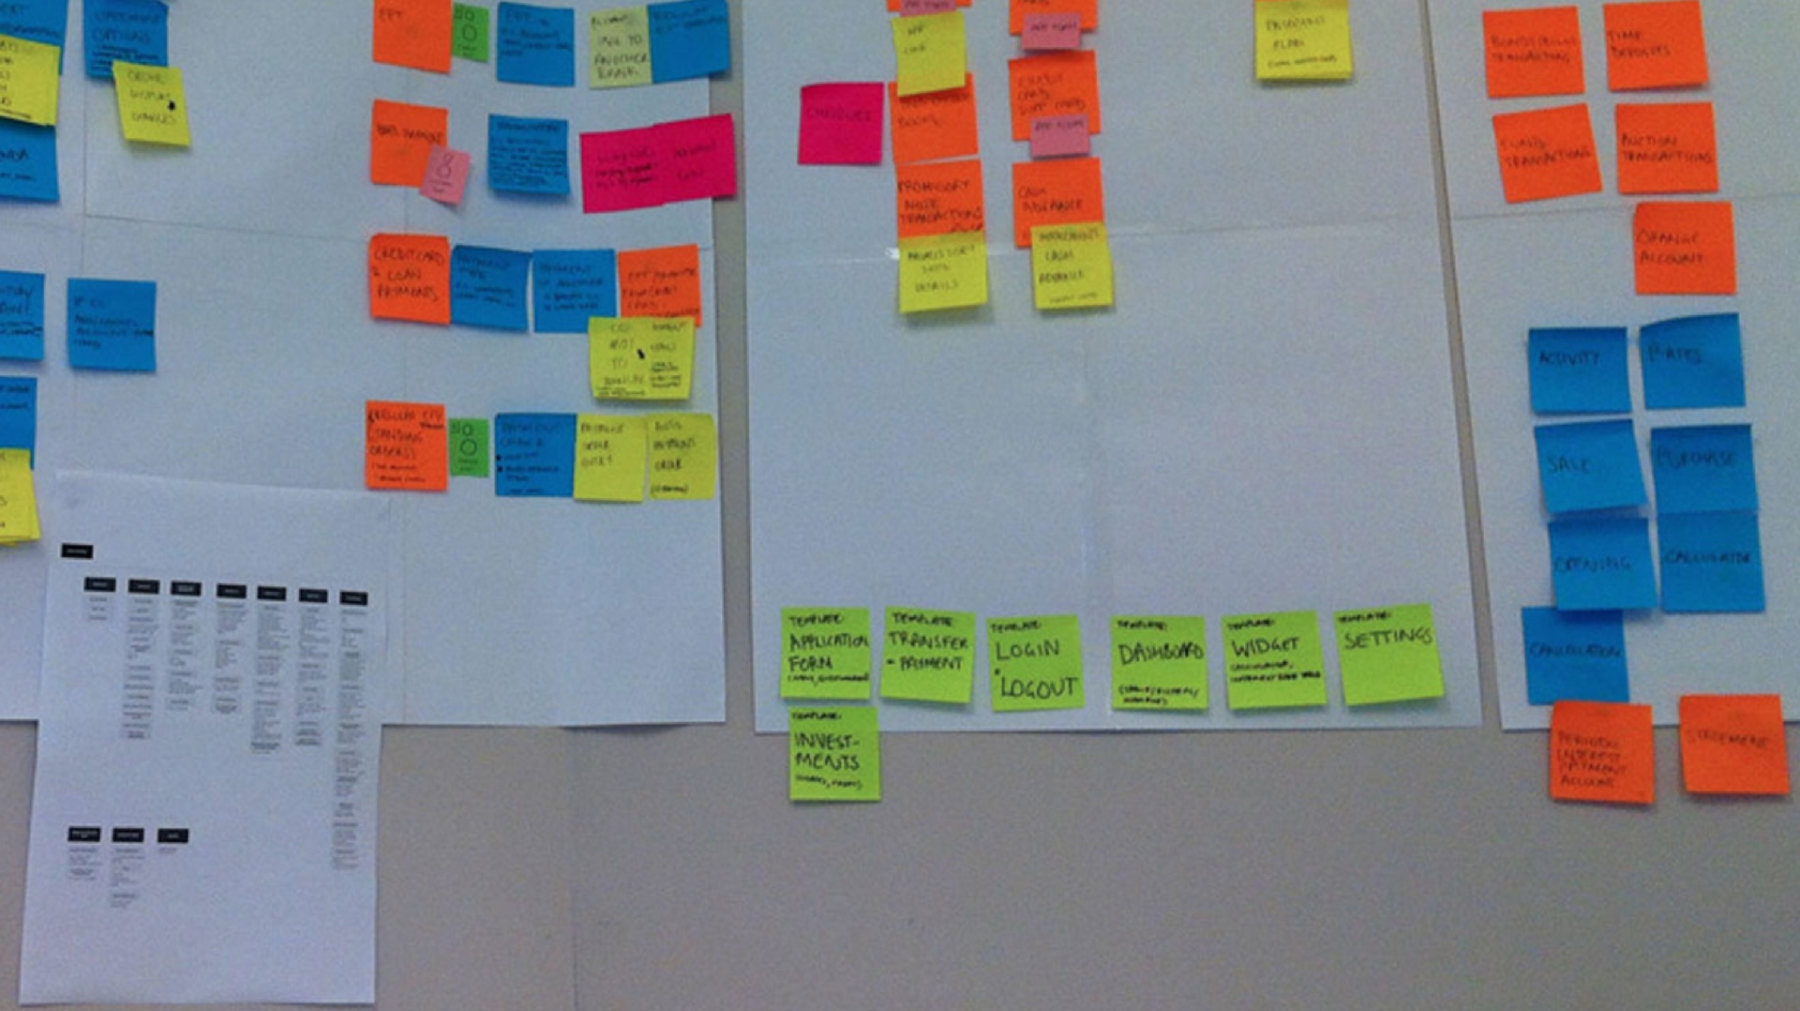
A modular Information Architecture
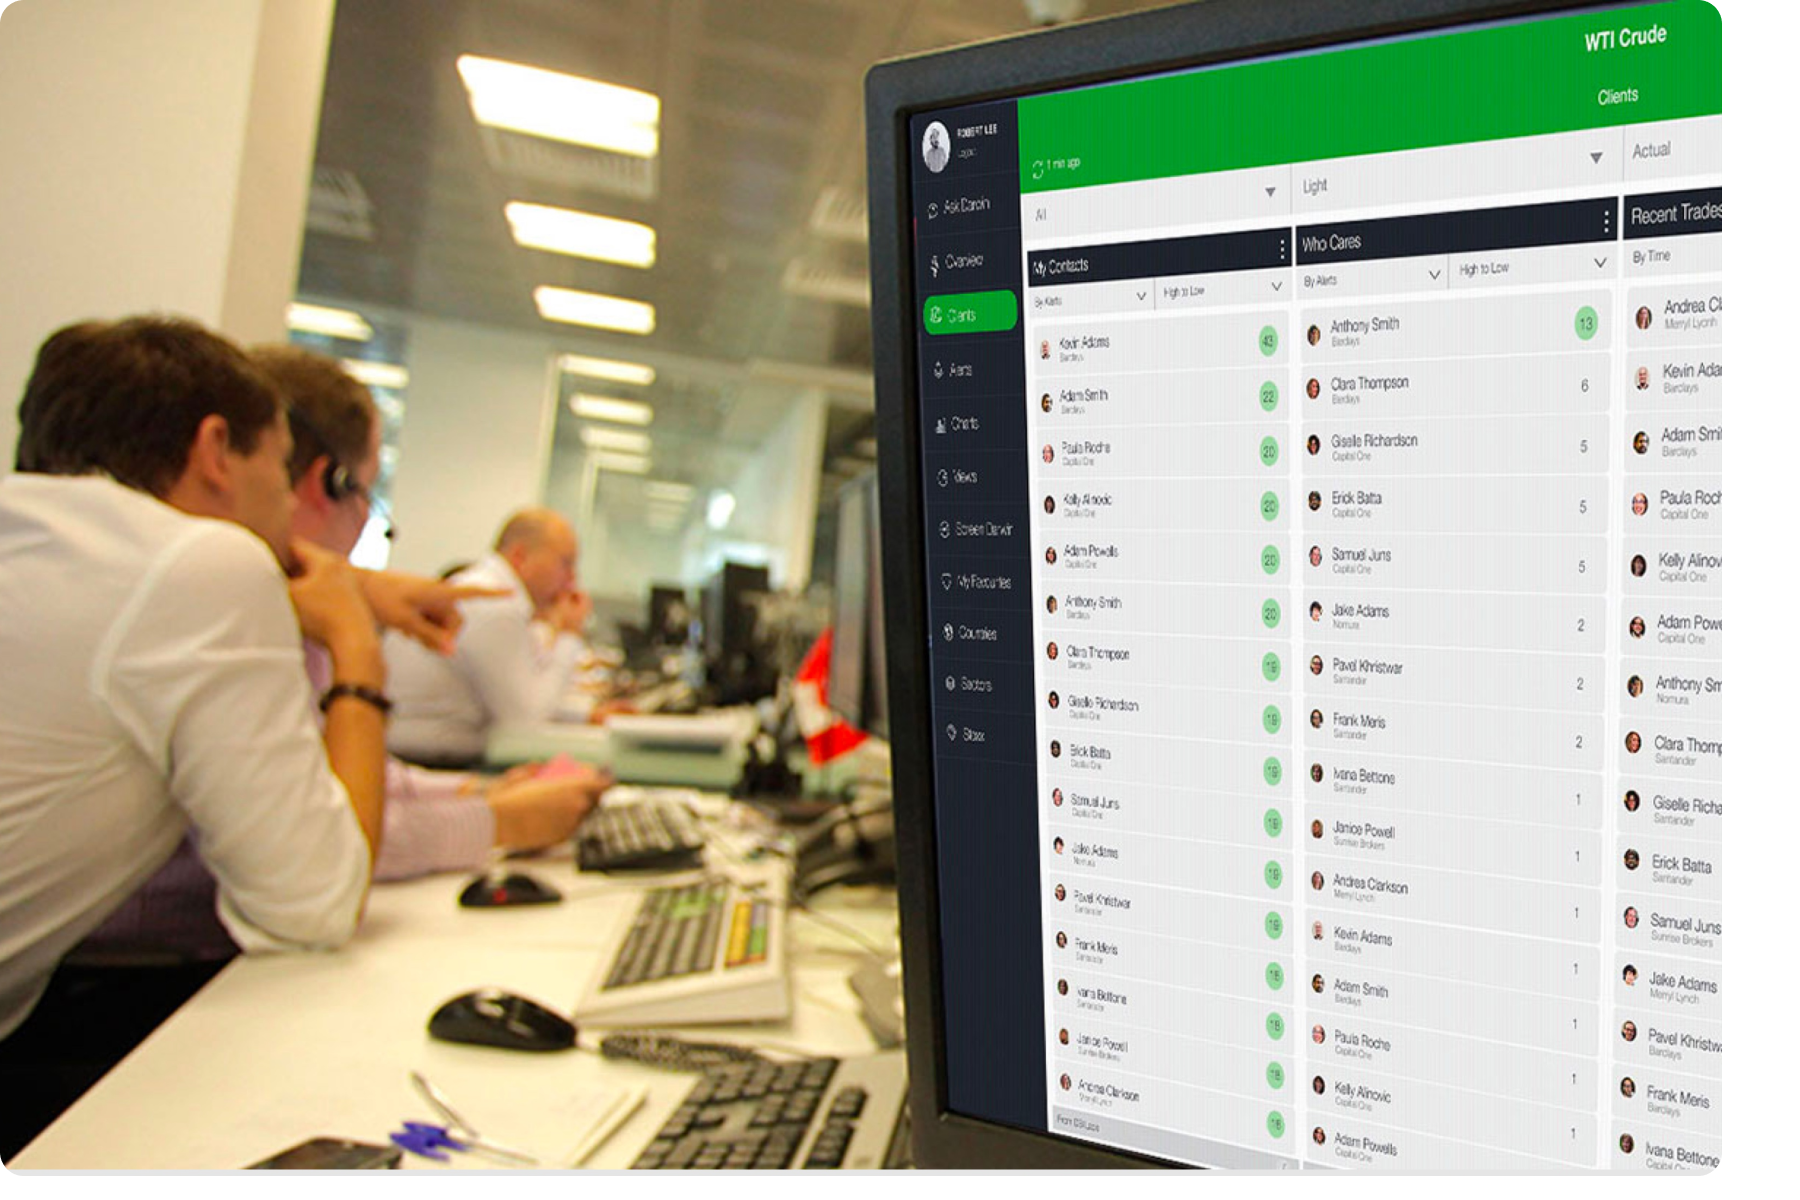
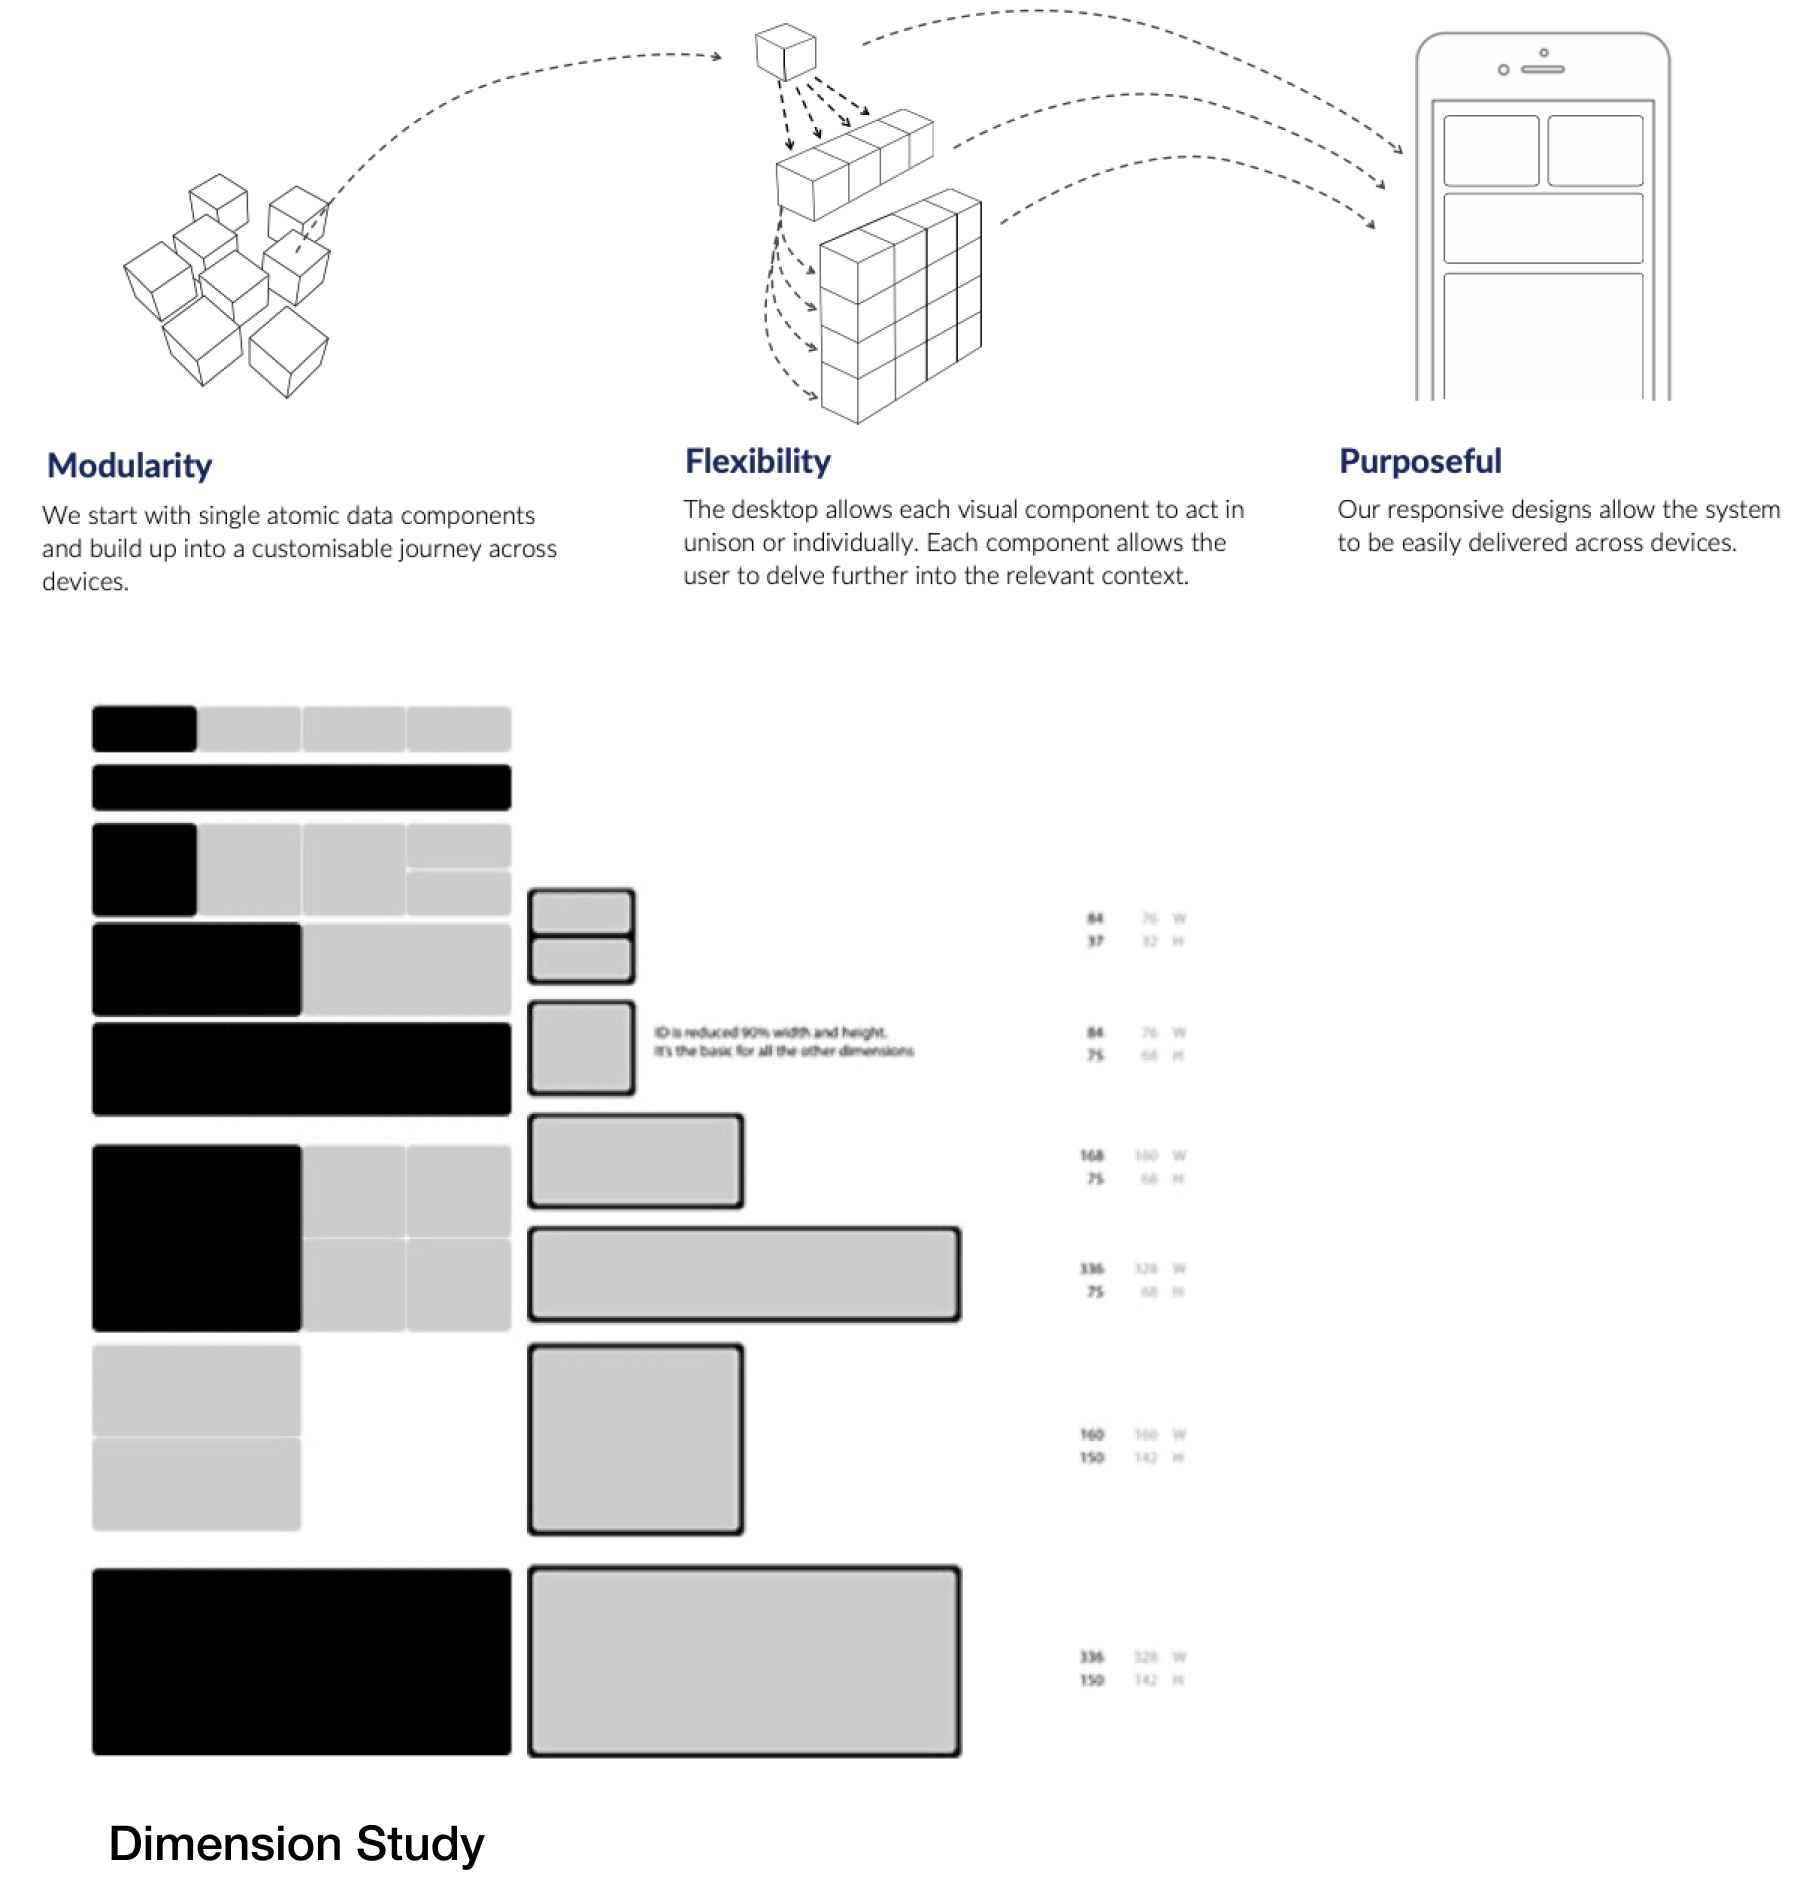
Crafting the information architecture for Beagle was like building with LEGO bricks, albeit with infinitely more complexity and stakes. Every widget, every interaction was designed to ensure seamless navigation and deep, intuitive engagement across devices.
An important part has been creating clear, actionable interactions to make it easy for the investor to navigate complexity, disclosing data representation complexity only in specific sections and keeping the default view readable and actionable.
Problem
A significant UX challenge was presenting complex financial data in a way that was both accessible to newcomers and valuable to seasoned professionals. The initial user feedback indicated that our interface could be intimidating, potentially alienating users less familiar with dense financial data.
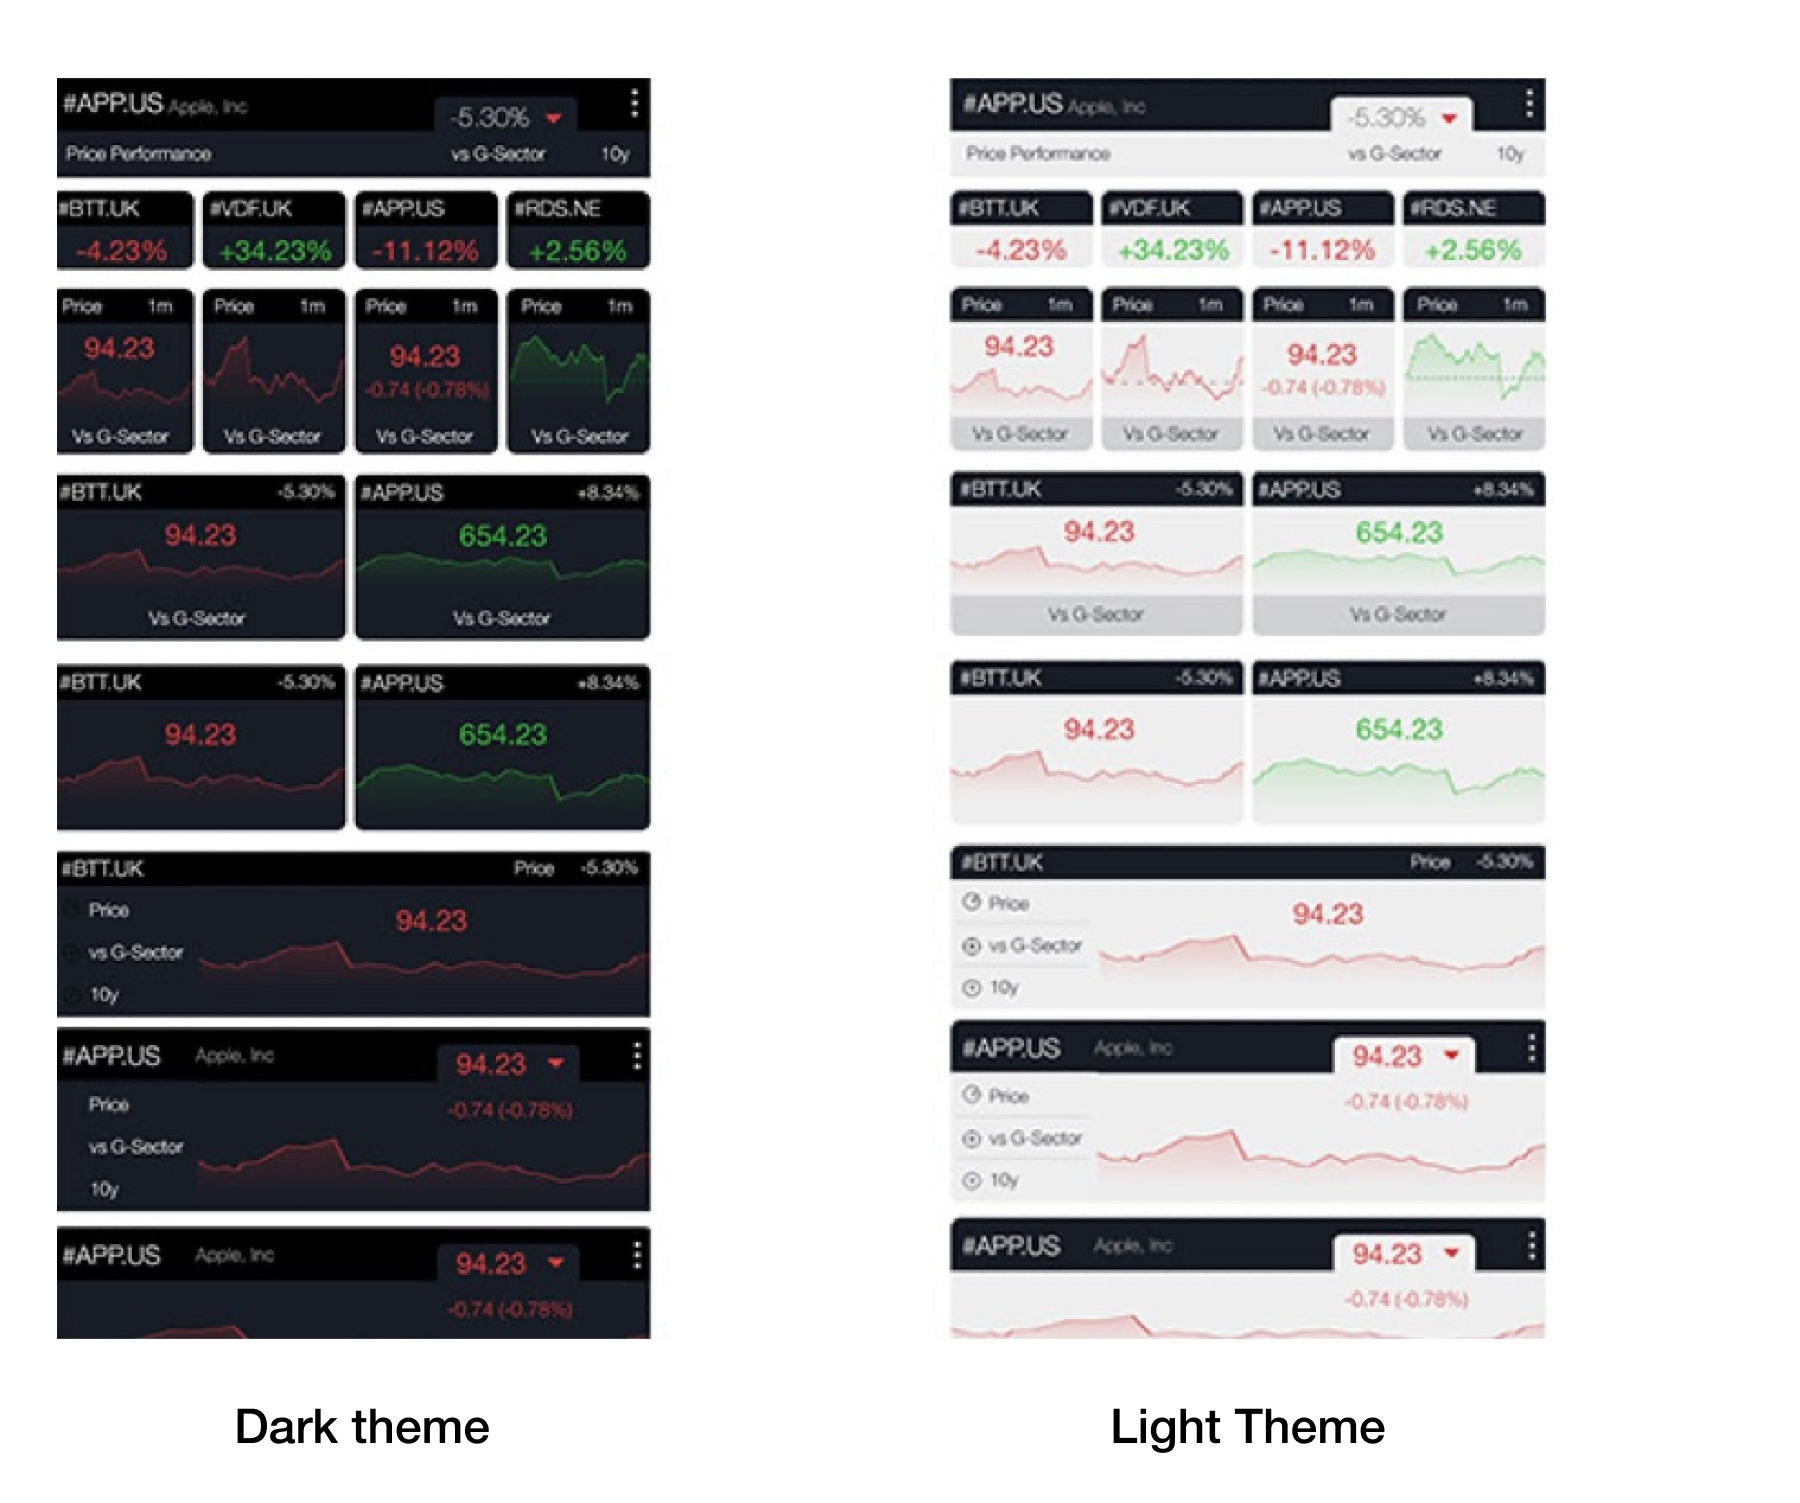
Solution
We adopted a modular design approach, creating customizable widgets that users could tailor to their preferences. This not only made the interface more approachable but also allowed users to create personalized dashboards. We further enhanced usability by implementing clear, intuitive interactions that guided users deeper into the data as needed, based on user testing feedback.
Crafting a modular Interface
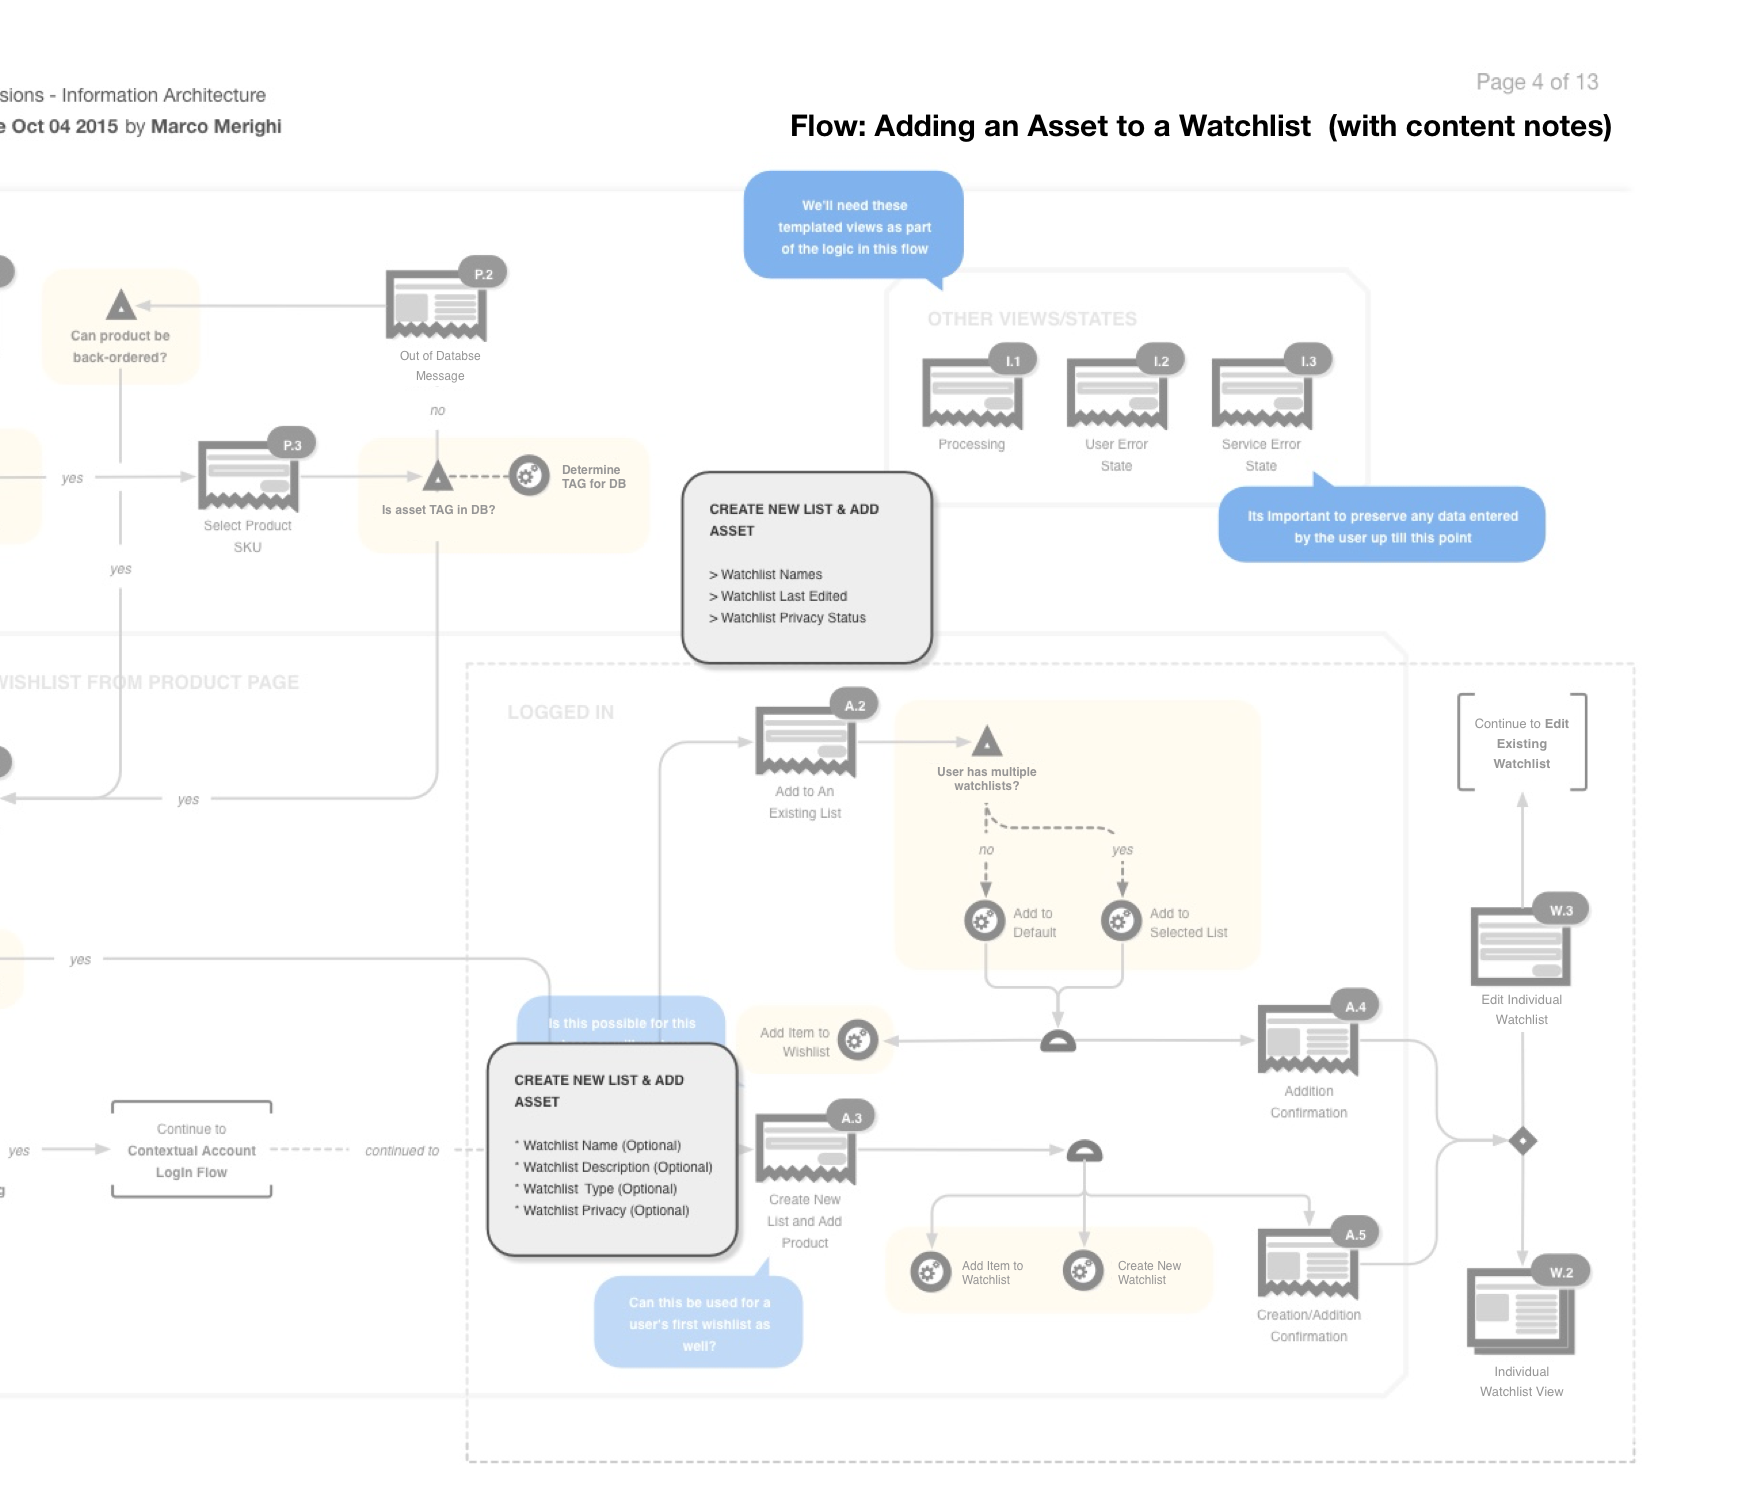
The challenge of creating a scalable and responsive UI led to the need of deeply understanding information architecture of core users flows like: search a contact contact, create a watchlist, add/remove stock, compare charts.
Problem
As the project progressed, ensuring that Beagle's interface was scalable and responsive across various devices emerged as a technical and design challenge. Our goal was for the platform to be equally effective and engaging on a mobile device as on a desktop, a necessity for the modern financial professional.
Solution
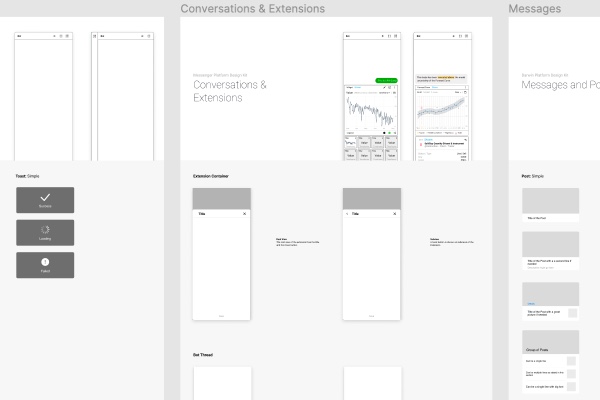
Partenering up with development and product we focused on a mobile-first responsive design from the ground up, creating wireframes and prototypes that were tested across multiple devices. Additionally, the widget-based approach allowed for greater flexibility and scalability, ensuring that each component provided value individually and as part of the larger system.
Responsive Widget
Designing widgets that could adapt across various devices and screen sizes, we ensured that each component, from the smallest 1x1 to the expanded 8x16 was not just a standalone design but perceived as part of a cohesive intuitive ecosystem. This focus on modularity and user-centric design was critical in making financial data accessible and actionable.
Testing Widgets
We wanted to leverage this opportunity of having real users right next to us, so the development from wireframes to prototypes was a commitment to our need for user feedback: we target four core widget (RSI, Price, Sentiment, ) started by developing few code-based core widget to be tested with users iteration brought us closer to a solution that resonated with our target audience, with designs evolving to meet the nuanced demands of financial professionals. This process underscored the non-linear, iterative journey of UX design, where feedback is not just a checkpoint but a crucial driver of development.
Problem
Balancing user expectations with the actual capabilities of AI was a challenge, especially given the internal hype surrounding SAS AI's potential. Users expected the platform to provide instant, highly accurate insights, a tall order given the complexities of financial data and the nascent stage of our AI's training.
Solution
We addressed this by setting realistic expectations through our UI/UX, using tooltips and guides to educate users on how the AI works and its limitations. Parallelly, we implemented a feedback loop where users could report inaccuracies or suggest improvements, which was invaluable for training the AI. This approach not only improved our AI over time but also built trust with our users by being transparent about the platform's development process.
MVP
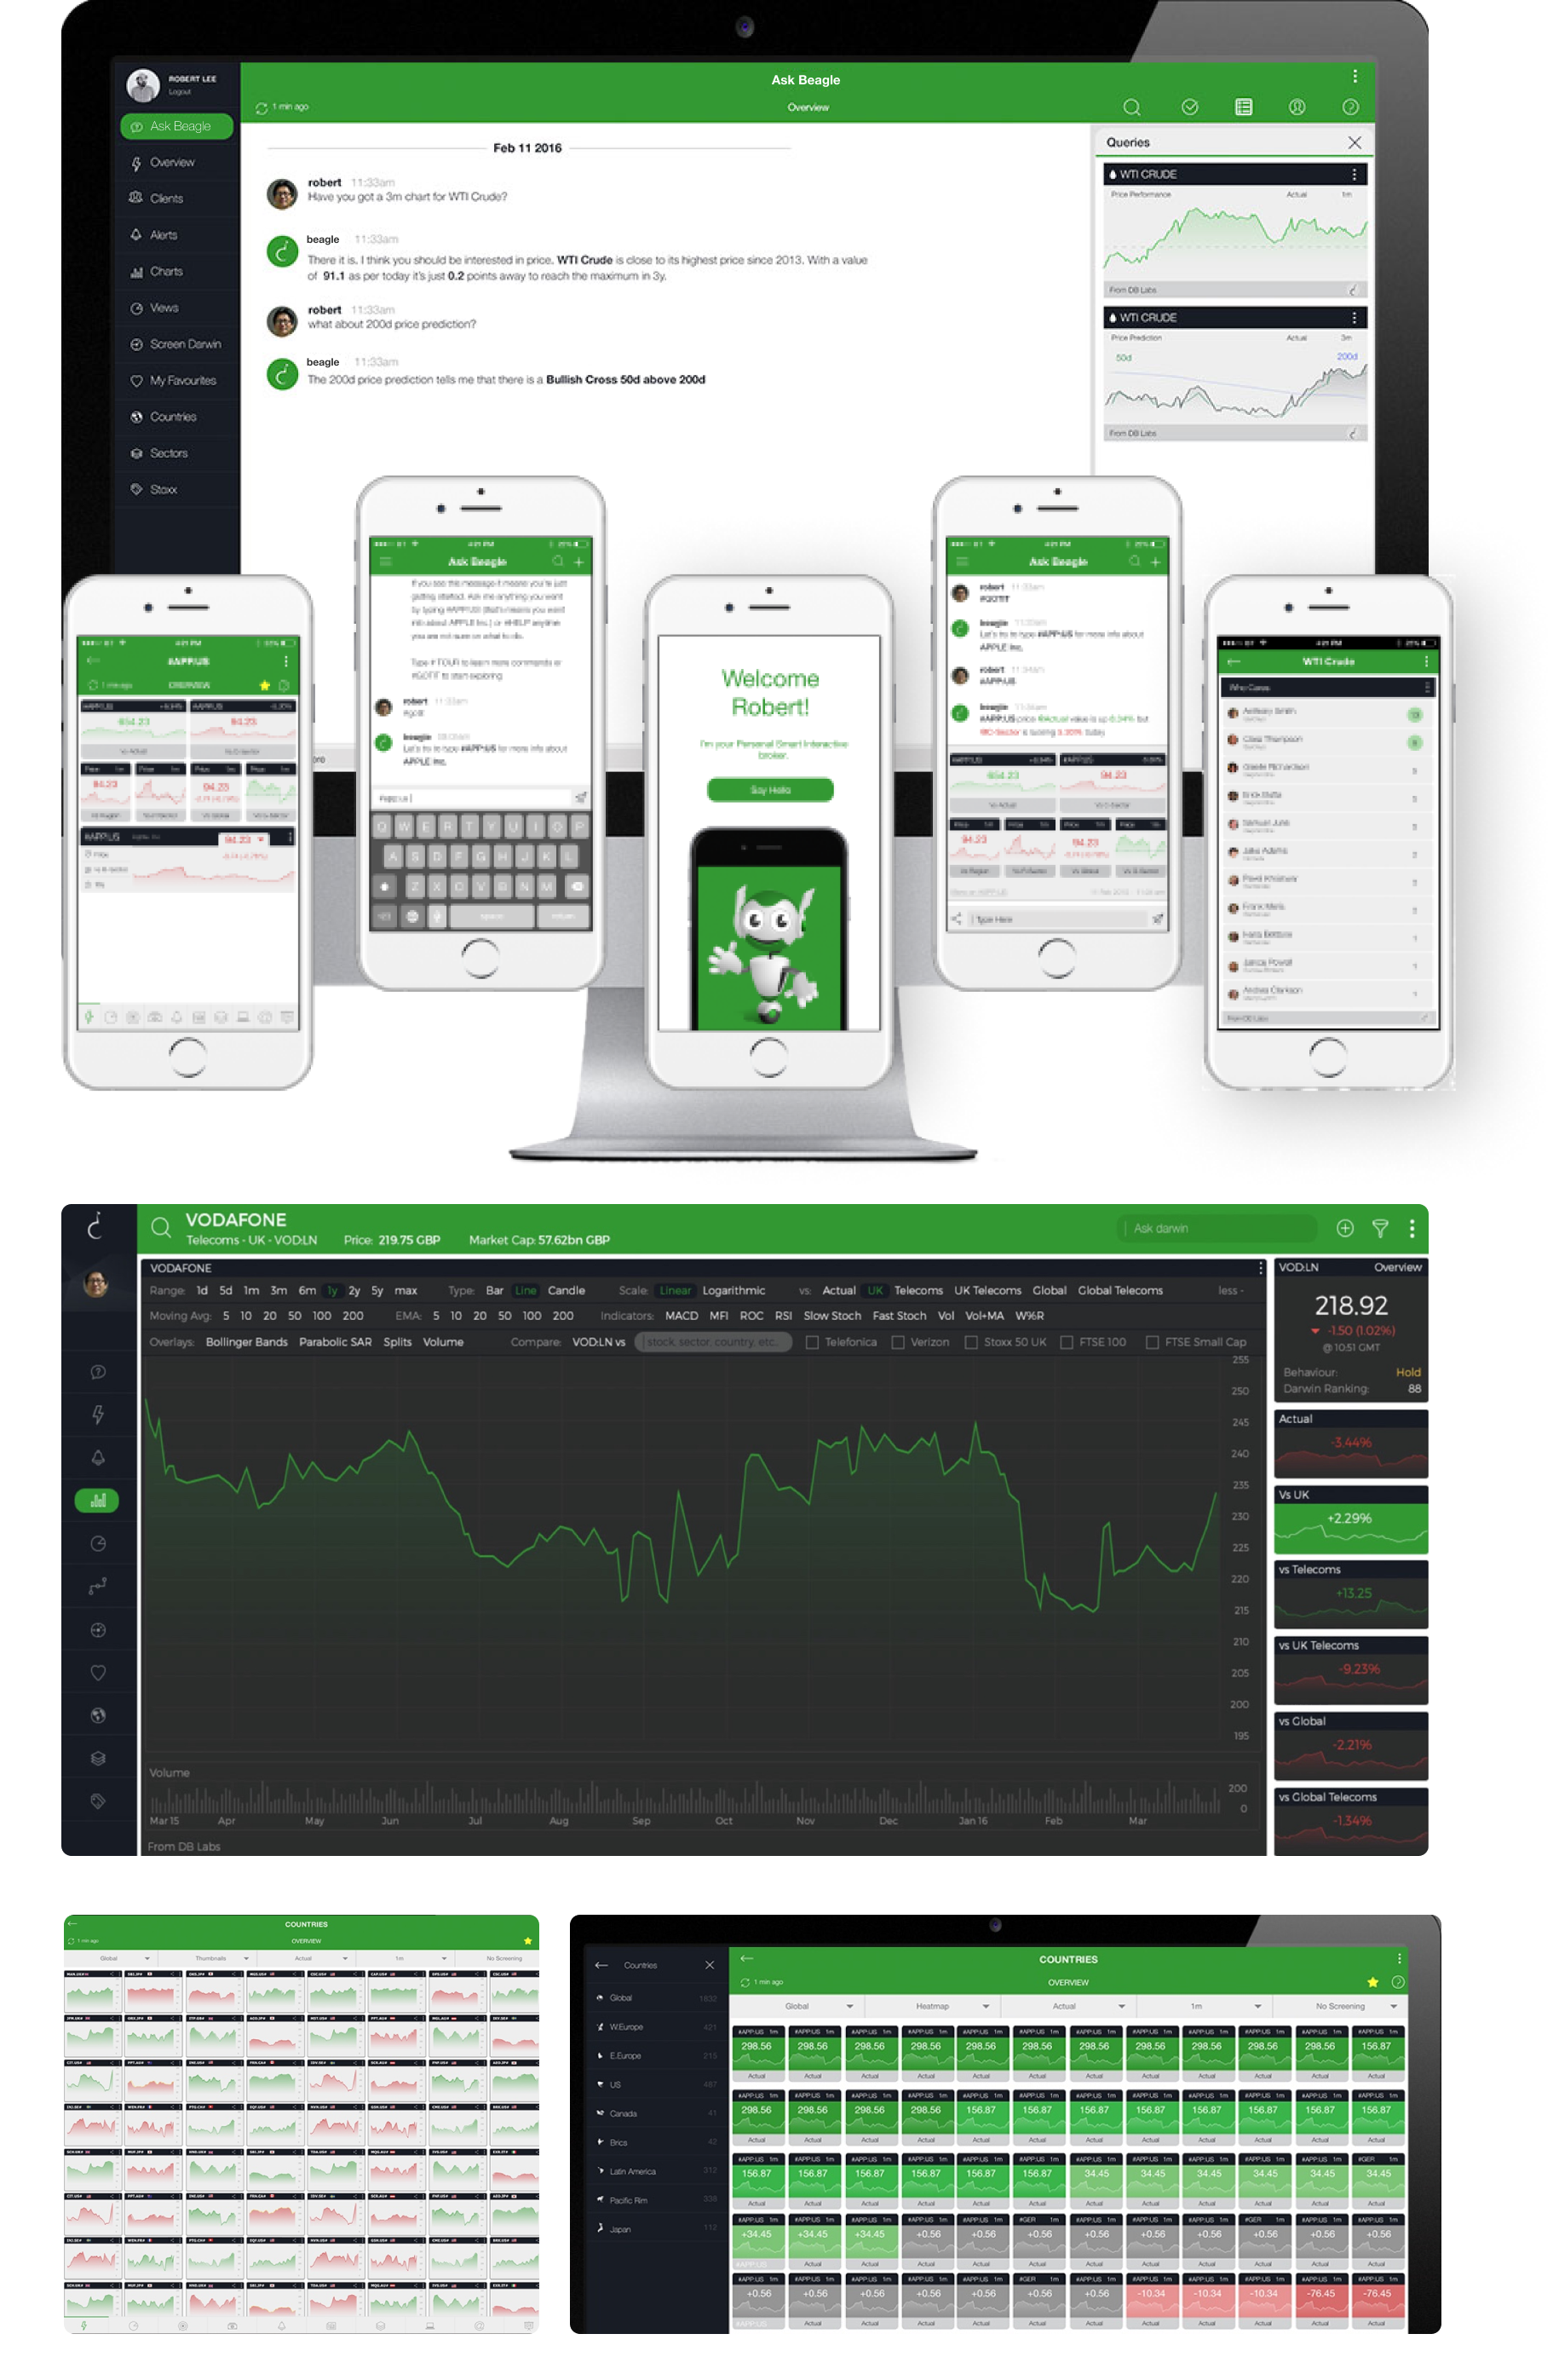
Our MVP used the power of AI to streamline data integration and provide a nuanced layer of market analysis across platforms.
Key Features:
- Intelligent Data Synthesis: Wether from desktop or mobile user are able to synthesizing vast amounts of market data into concise, actionable insights.
- Sentiment Analysis: With every stock related answer comes a gauge widget showing the Social Media sentiment around each financial instrument
- Tailored Alerts System: The alert mechanism account for each user's trading patterns, risk appetite, and preferences, delivering personalized alerts to traders.
- Adaptable UI: The UI offers users a modular dashboard that they can personalize to their workflow
The development of the MVP was a collaborative and iterative process, incorporating feedback from real-world user scenarios. We emphasized a design that would seamlessly fit into the existing technology ecosystem of our users allowing for immediate adoption and maximum impact.
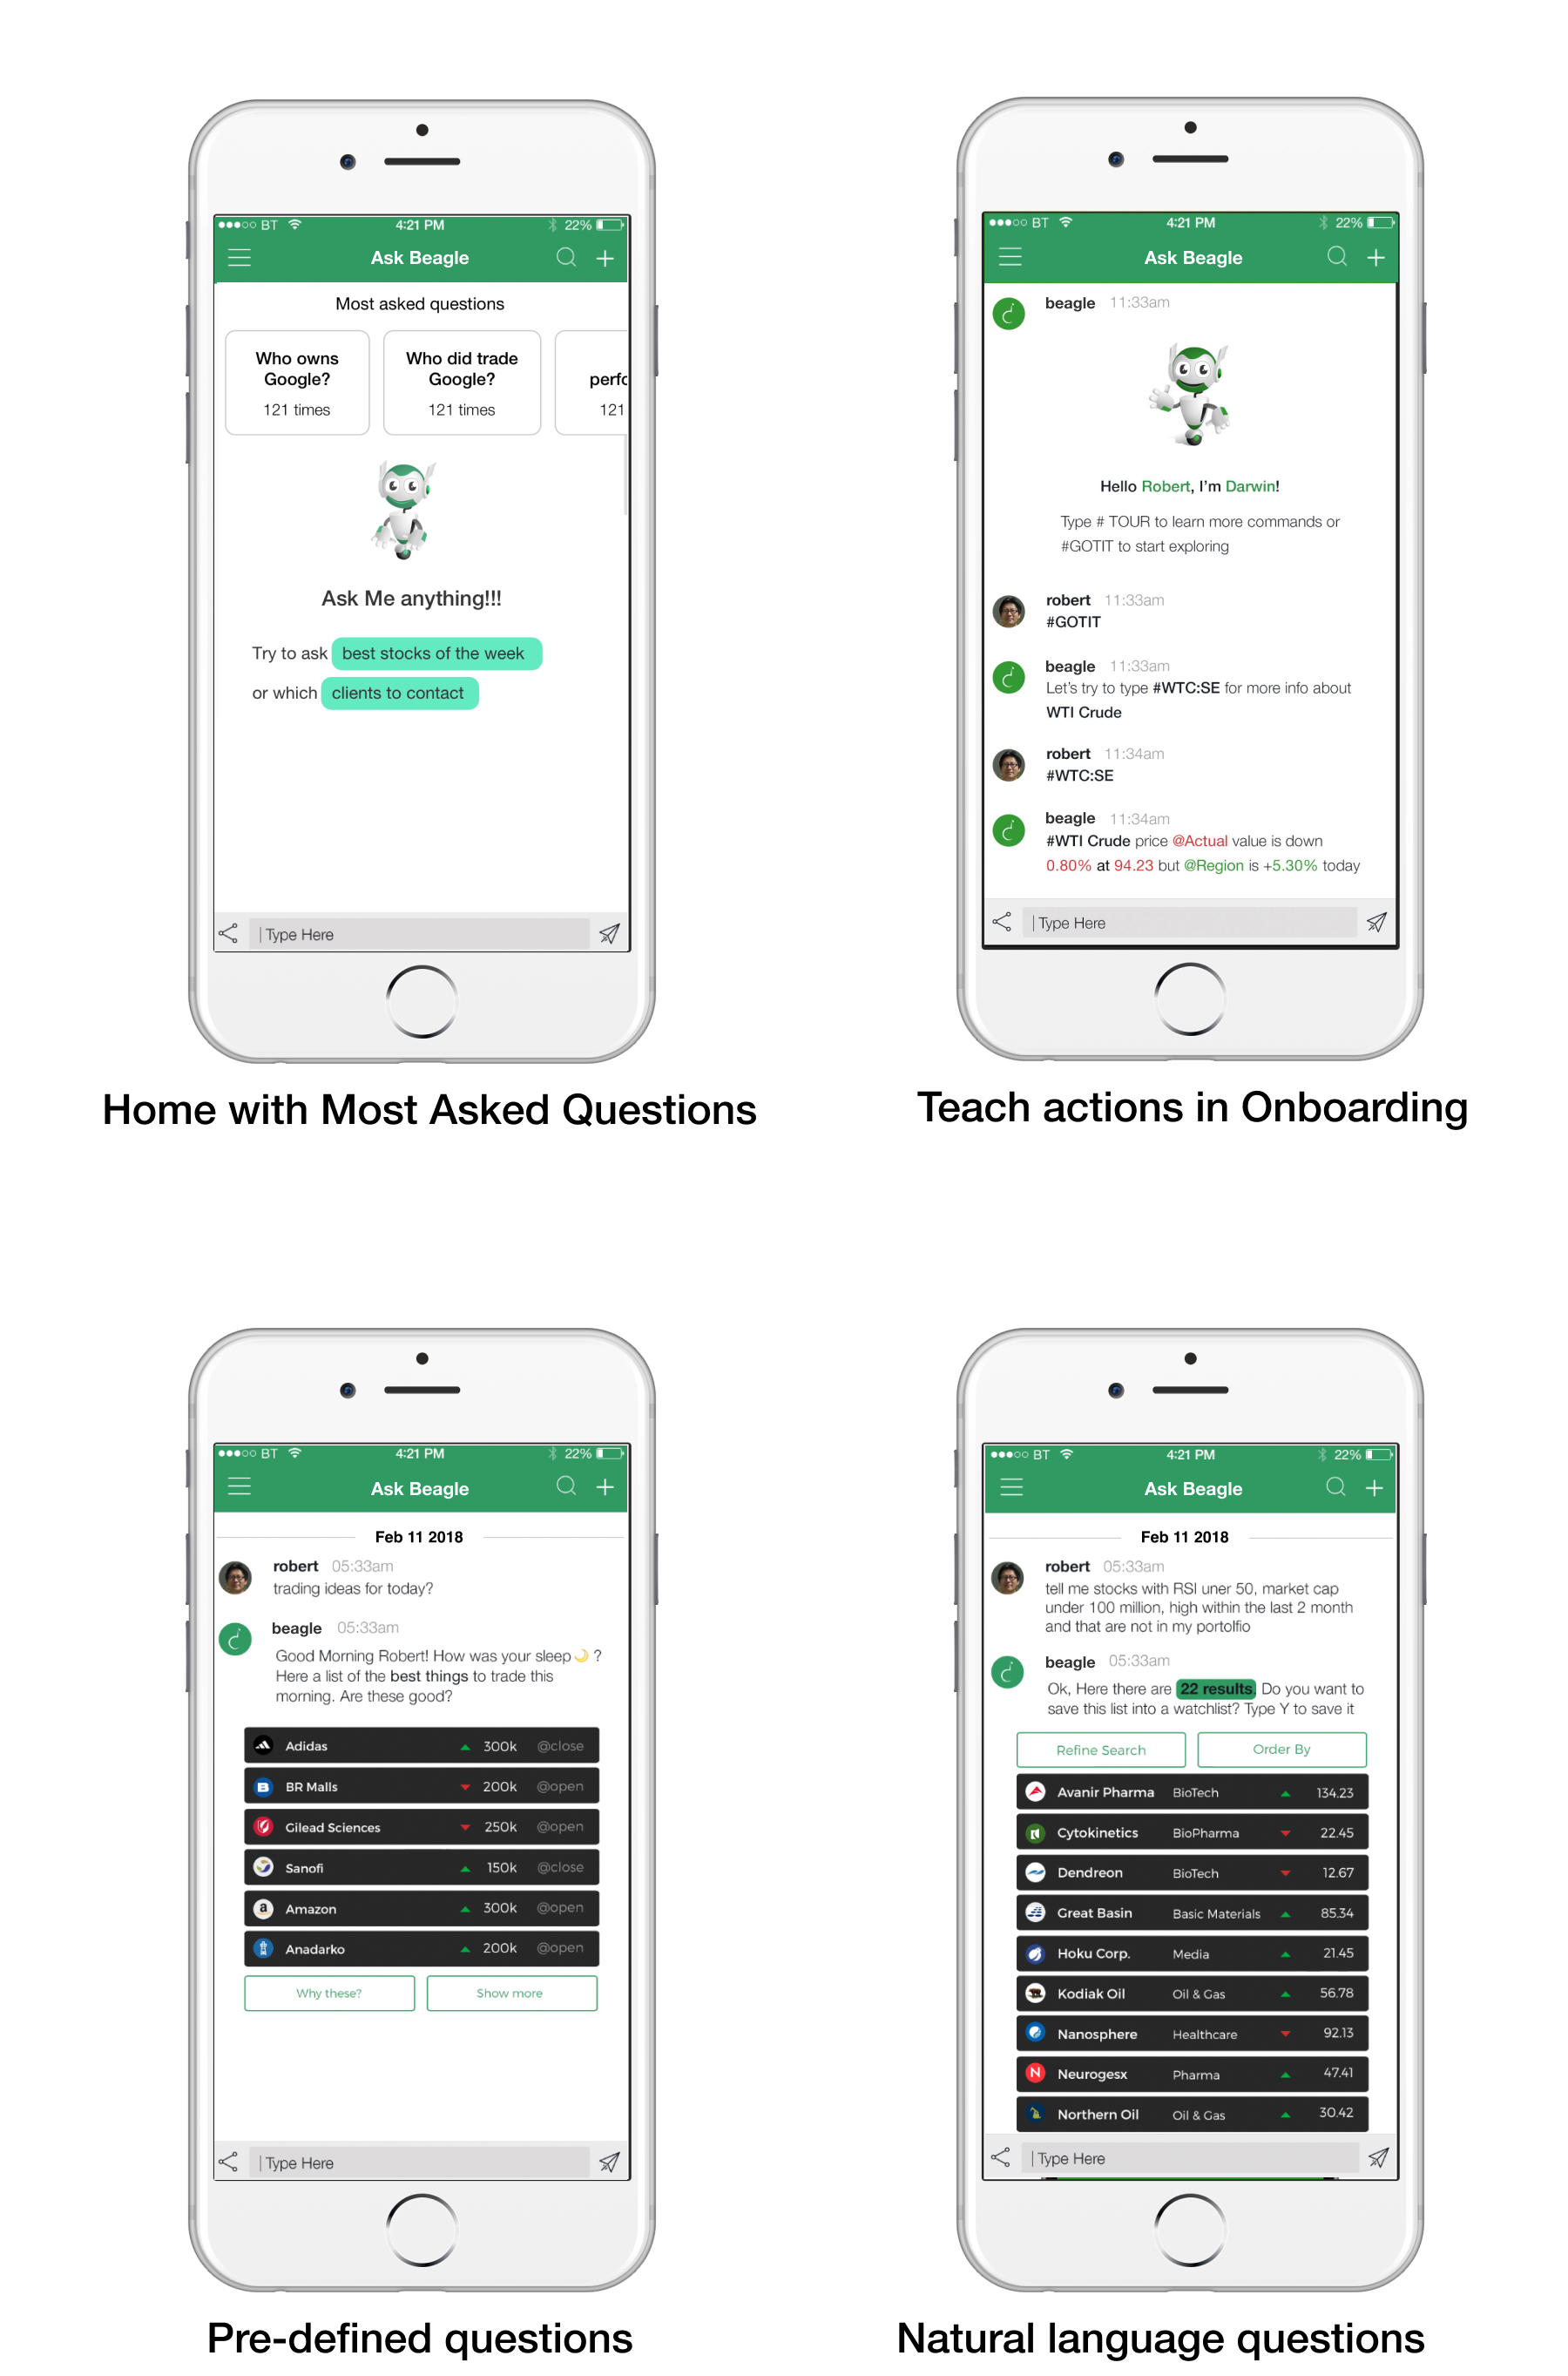
Beagle should be easy to query, fun to explore, immeadiate to get.
Solution
User can access rich and dynamic dashboard on their office screens, while on the move they can ask, prepare and anticipate office tasks.
The positive reception of Beagle has been overwhelming with user engagement metrics surpassing our expectations and SAS using the Beagle Case Study on their website for quite a while.
With its success Beagle has established itself as a core feature of our client's offerings to attract traders and financial professionals.
Modularity
I spent a lot of time working with the product manager trying to create a perfect modular, responsive and elegant way to visualise data across multiple devices, realising no perfect way existed. I learned to prioritise widget components and think scalability vs perfection.
Prioritise feature
Using the gap analysis formula helped me to give quantitative value to the choice we made and to create clear red routes for development. It should have been useful to use the Kano model to identify expected and desired features to create a better understanding of the users'expecations from the sistem, but timelines and restricted team were a problem.